Fig. A.2
Download original image
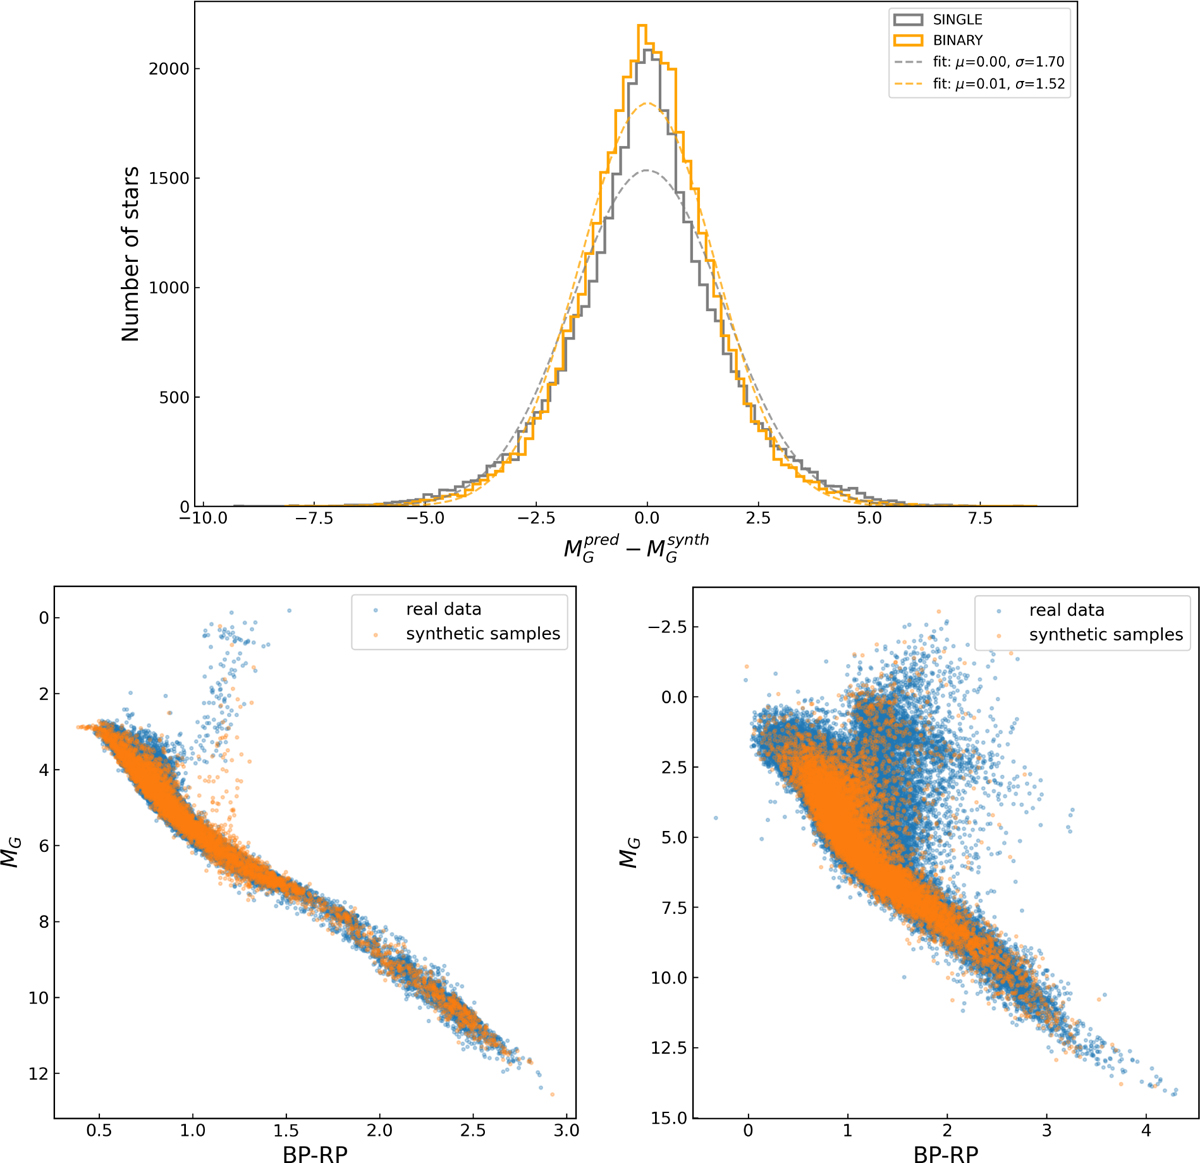
TOP: Distribution of the residuals ![]() for single and binary samples with corresponding Gaussian fits to the residuals. BOTTOM LEFT: Colour-magnitude diagram of the 100000 single (blue) sources and synthetic color-magnitude diagram with conditionally sampled color and magnitude values (orange). BOTTOM RIGHT: equivalent plot for the binaries with real binaries in (blue) and synthetic color-magnitude diagram with conditionally sampled color and magnitude values (orange).
for single and binary samples with corresponding Gaussian fits to the residuals. BOTTOM LEFT: Colour-magnitude diagram of the 100000 single (blue) sources and synthetic color-magnitude diagram with conditionally sampled color and magnitude values (orange). BOTTOM RIGHT: equivalent plot for the binaries with real binaries in (blue) and synthetic color-magnitude diagram with conditionally sampled color and magnitude values (orange).
Current usage metrics show cumulative count of Article Views (full-text article views including HTML views, PDF and ePub downloads, according to the available data) and Abstracts Views on Vision4Press platform.
Data correspond to usage on the plateform after 2015. The current usage metrics is available 48-96 hours after online publication and is updated daily on week days.
Initial download of the metrics may take a while.