Fig. 5
Download original image
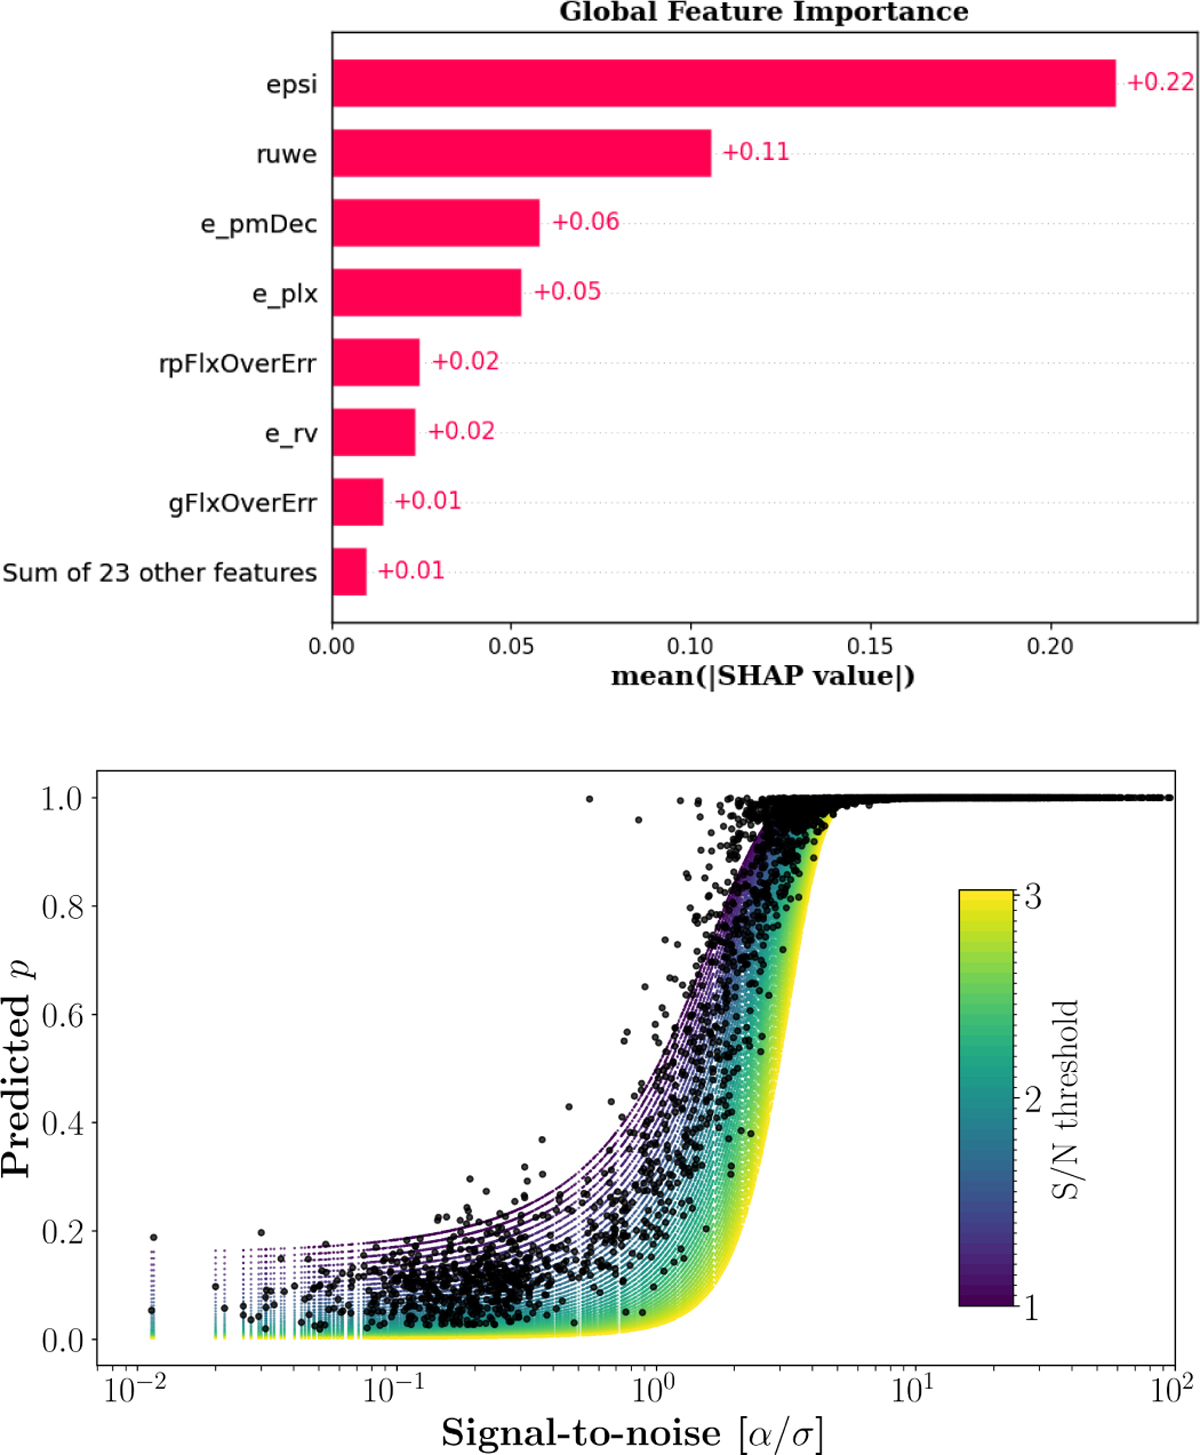
Top: parameter impact on the model output as estimated by the neural network model ranked by decreasing impact. High parameter values are color-coded in red, while low values are displayed in blue. Bottom: predicted probability for each binary star example on the test dataset (black dots), together with a detection probability proxy computed as p=1−Φ(S/N, δ)), where Φ is the CDF of the normal distribution, S/N=α/σ, and δ is a variable S/N threshold from 1 to 3.
Current usage metrics show cumulative count of Article Views (full-text article views including HTML views, PDF and ePub downloads, according to the available data) and Abstracts Views on Vision4Press platform.
Data correspond to usage on the plateform after 2015. The current usage metrics is available 48-96 hours after online publication and is updated daily on week days.
Initial download of the metrics may take a while.