Fig. 8
Download original image
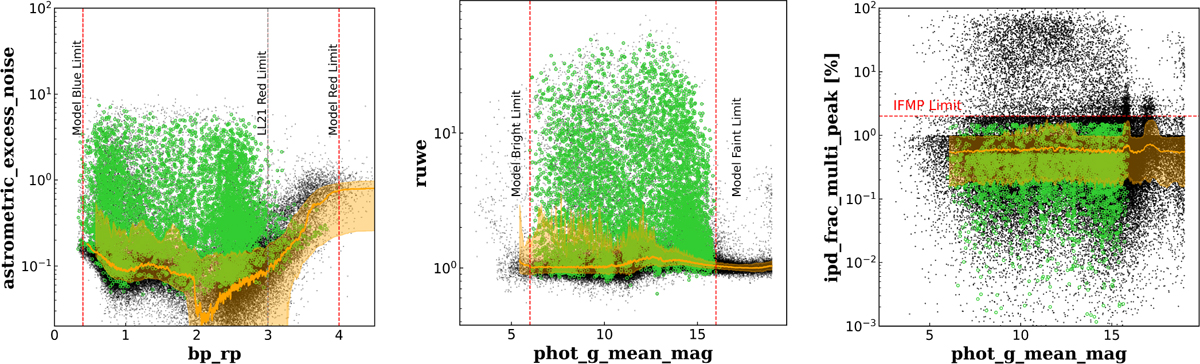
Left: astrometric_excess_noise vs. Gaia color bp_rp. Model inputs are displayed in black and candidates in green. The vertical red lines show the applied color cuts. Orange line corresponds to the running median of the excess noise and the shaded orange region corresponds to the 16th-84th percentiles. Middle: equivalent plot but for ruwe vs. Gaia G band magnitude. The vertical red lines show the applied bright and faint Gaia magnitude cuts. Right: equivalent plot but for ipd_frac_multi_peak vs. Gaia G magnitude. The horizontal red line corresponds to the selected cut-off limit for this parameter.
Current usage metrics show cumulative count of Article Views (full-text article views including HTML views, PDF and ePub downloads, according to the available data) and Abstracts Views on Vision4Press platform.
Data correspond to usage on the plateform after 2015. The current usage metrics is available 48-96 hours after online publication and is updated daily on week days.
Initial download of the metrics may take a while.