Open Access
Fig. A.2.
Download original image
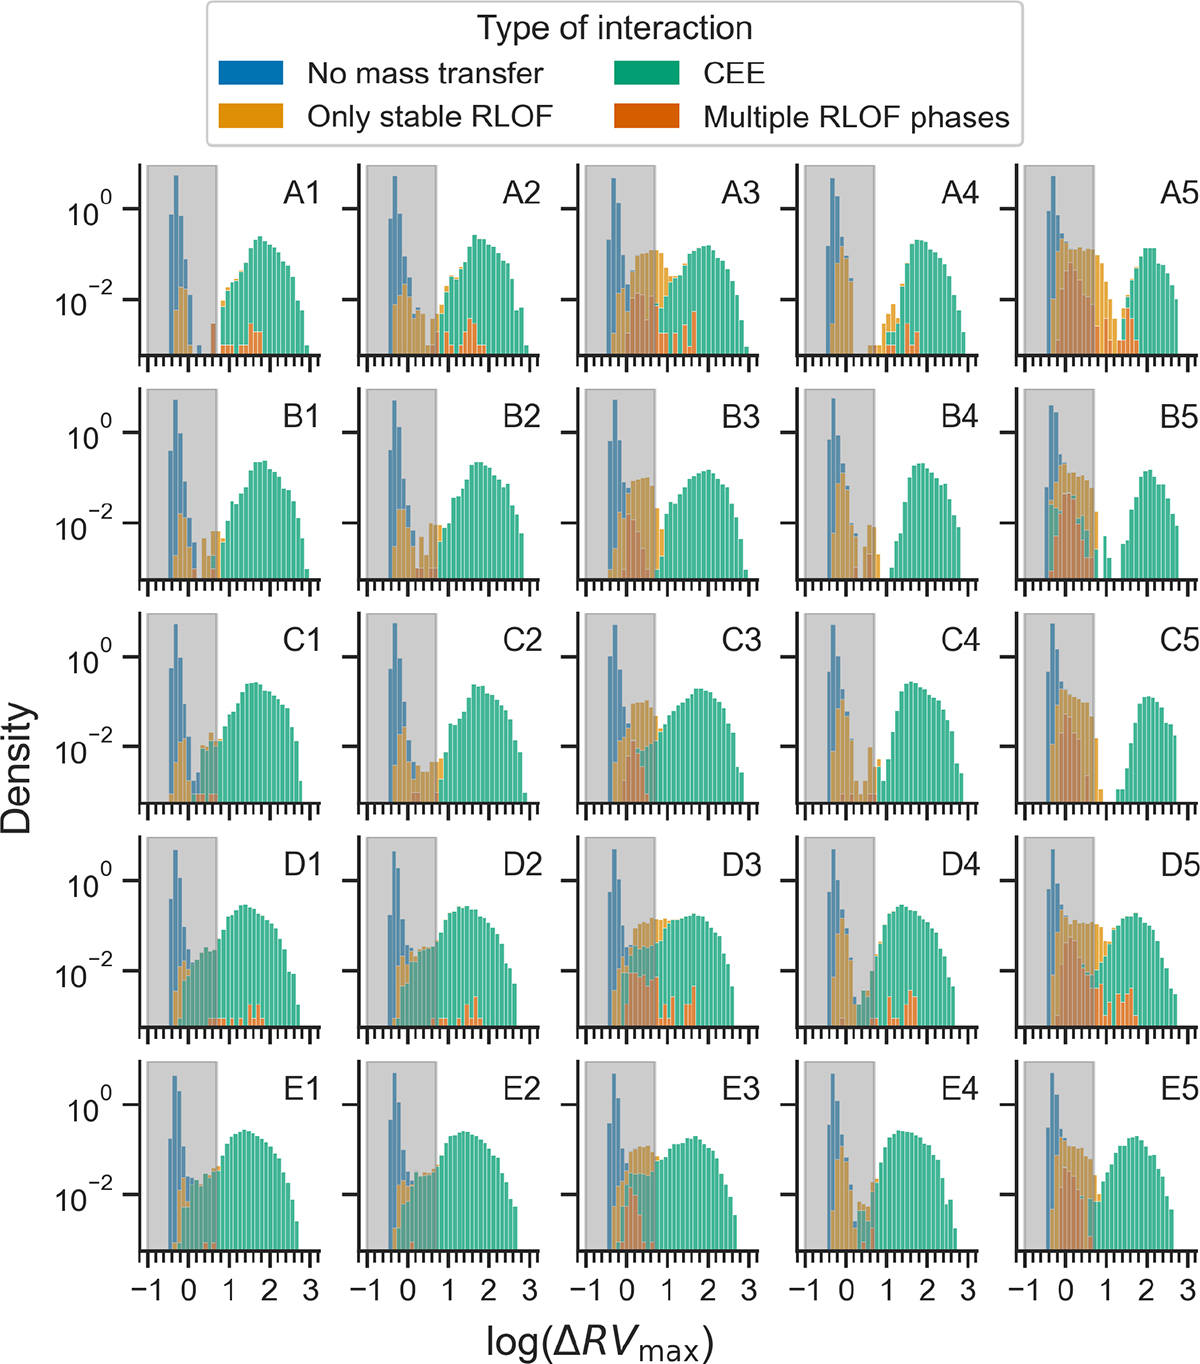
ΔRVmax distribution for all 25 COSMIC models, colored by the type of interaction the system suffered. The shaded gray region is the 5km/s cut. The ΔRVmax > 5km/s region is dominated by post-CEE WD+MS binaries.
Current usage metrics show cumulative count of Article Views (full-text article views including HTML views, PDF and ePub downloads, according to the available data) and Abstracts Views on Vision4Press platform.
Data correspond to usage on the plateform after 2015. The current usage metrics is available 48-96 hours after online publication and is updated daily on week days.
Initial download of the metrics may take a while.