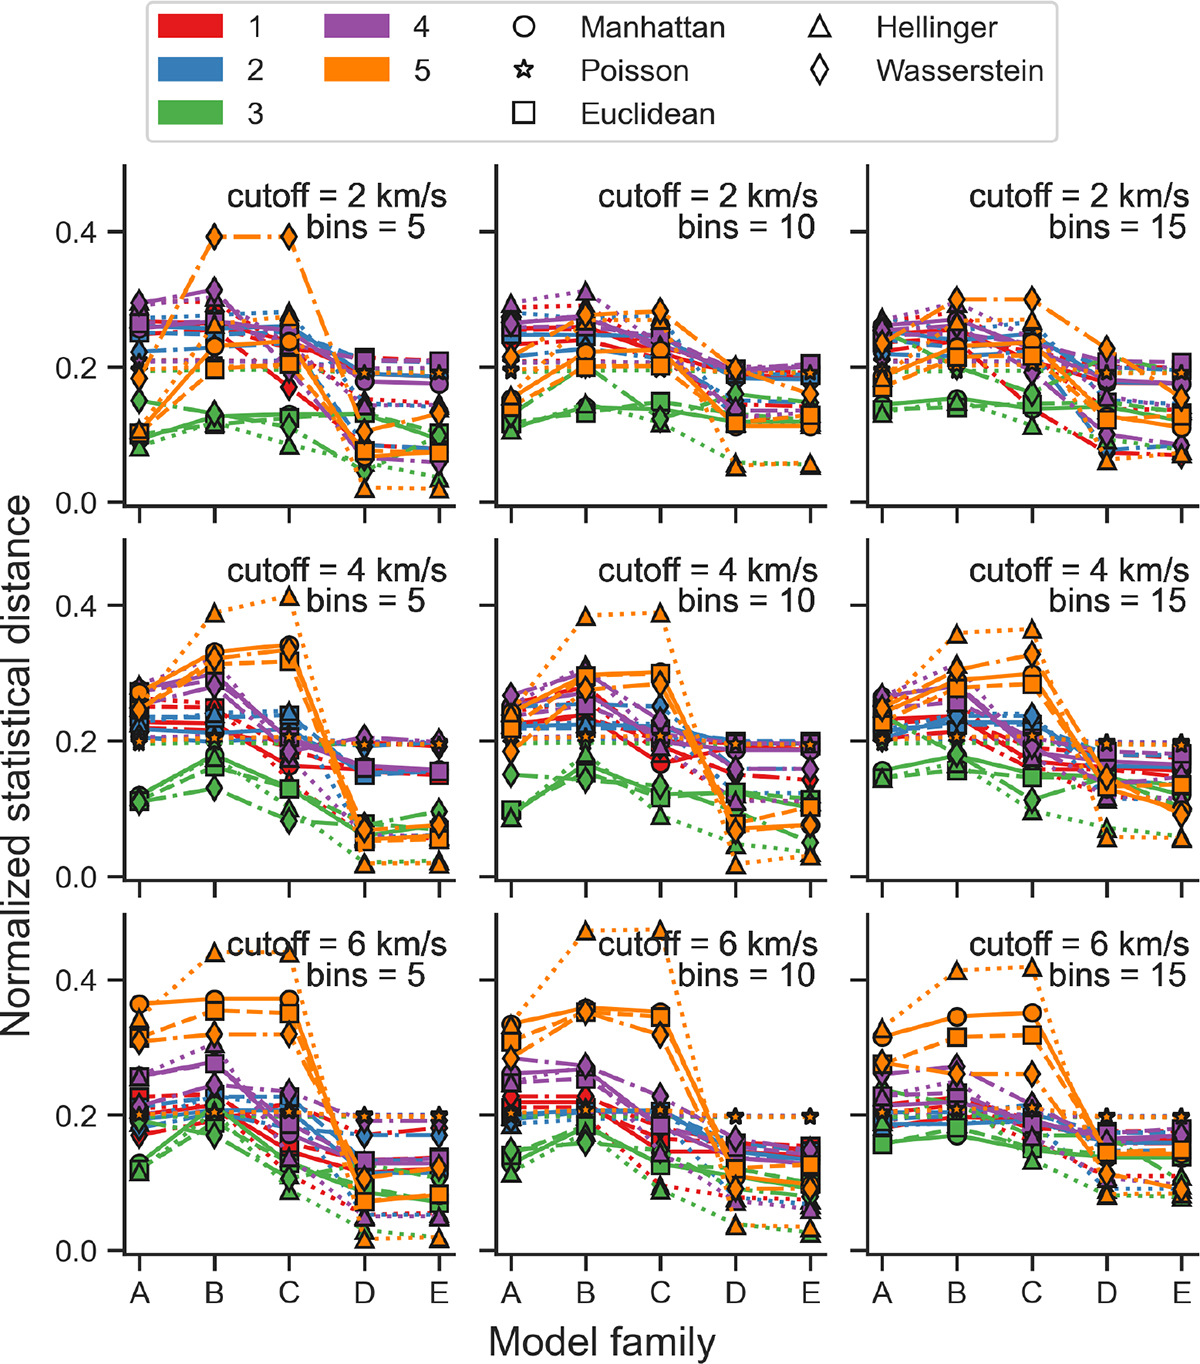
Fig. B.1.
Download original image
Normalized statistical distances between our COSMIC models and the AGGC ΔRVmax distribution, with varying cutoff values for the minimum ΔRVmax and number of bins in the compared histograms (histograms shown in Figure 6). The colors indicate the qset value, while the markers indicate different statistical measures. Models with qset = 3 and models with α = 5.0 (D and E) consistently show lower distances to the observational data, which corroborates our finding that these models are better matched to the available data.
Current usage metrics show cumulative count of Article Views (full-text article views including HTML views, PDF and ePub downloads, according to the available data) and Abstracts Views on Vision4Press platform.
Data correspond to usage on the plateform after 2015. The current usage metrics is available 48-96 hours after online publication and is updated daily on week days.
Initial download of the metrics may take a while.