Fig. 3.
Download original image
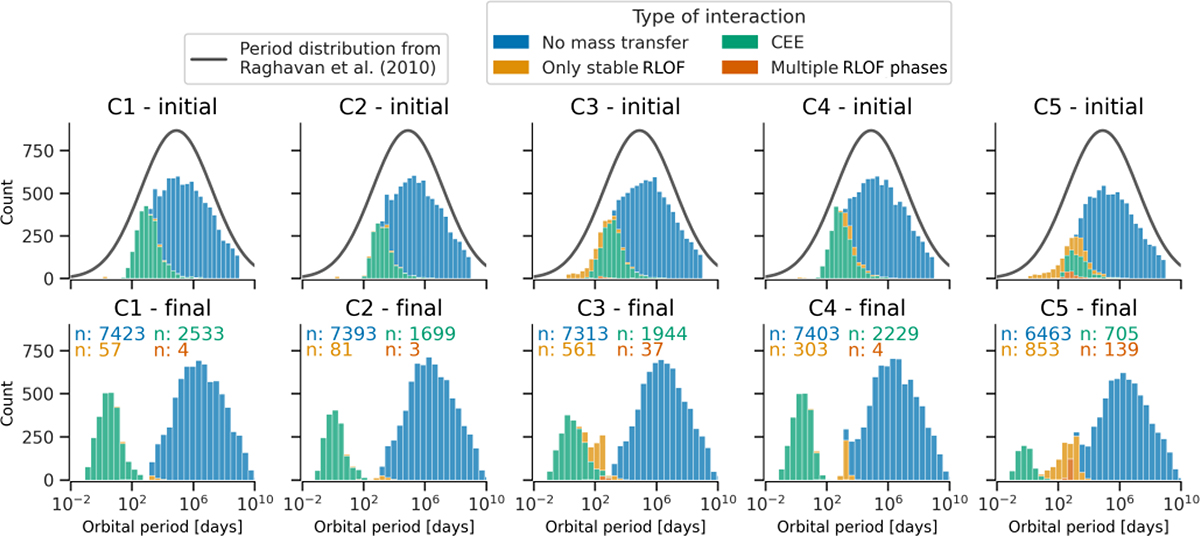
Initial (top rows) and final (bottom rows) period distribution for the WD+MS binaries in models C1, C2, C3, C4 and C5 (α = 1.0 and fully conservative mass transfer, with different prescriptions for qcrit, following Table 2 – colored histograms). The colors indicate the type of interaction the system undergoes to end up as a WD+MS binary. The numbers in the bottom rows indicate the number of systems in the final distribution according to type of interaction. The dark gray line in the top plots shows the normalized period distribution for the entire simulated population (following Raghavan et al. 2010), including systems that do not end up as WD+MS binaries, but as double WDs, MS+MS binaries, mergers, and WD binaries with post-MS stars. All models are initialized with the same period distribution. The final period distribution of the WD+MS binaries are quite different between the models, indicating a strong dependence on mass transfer stability assumptions.
Current usage metrics show cumulative count of Article Views (full-text article views including HTML views, PDF and ePub downloads, according to the available data) and Abstracts Views on Vision4Press platform.
Data correspond to usage on the plateform after 2015. The current usage metrics is available 48-96 hours after online publication and is updated daily on week days.
Initial download of the metrics may take a while.