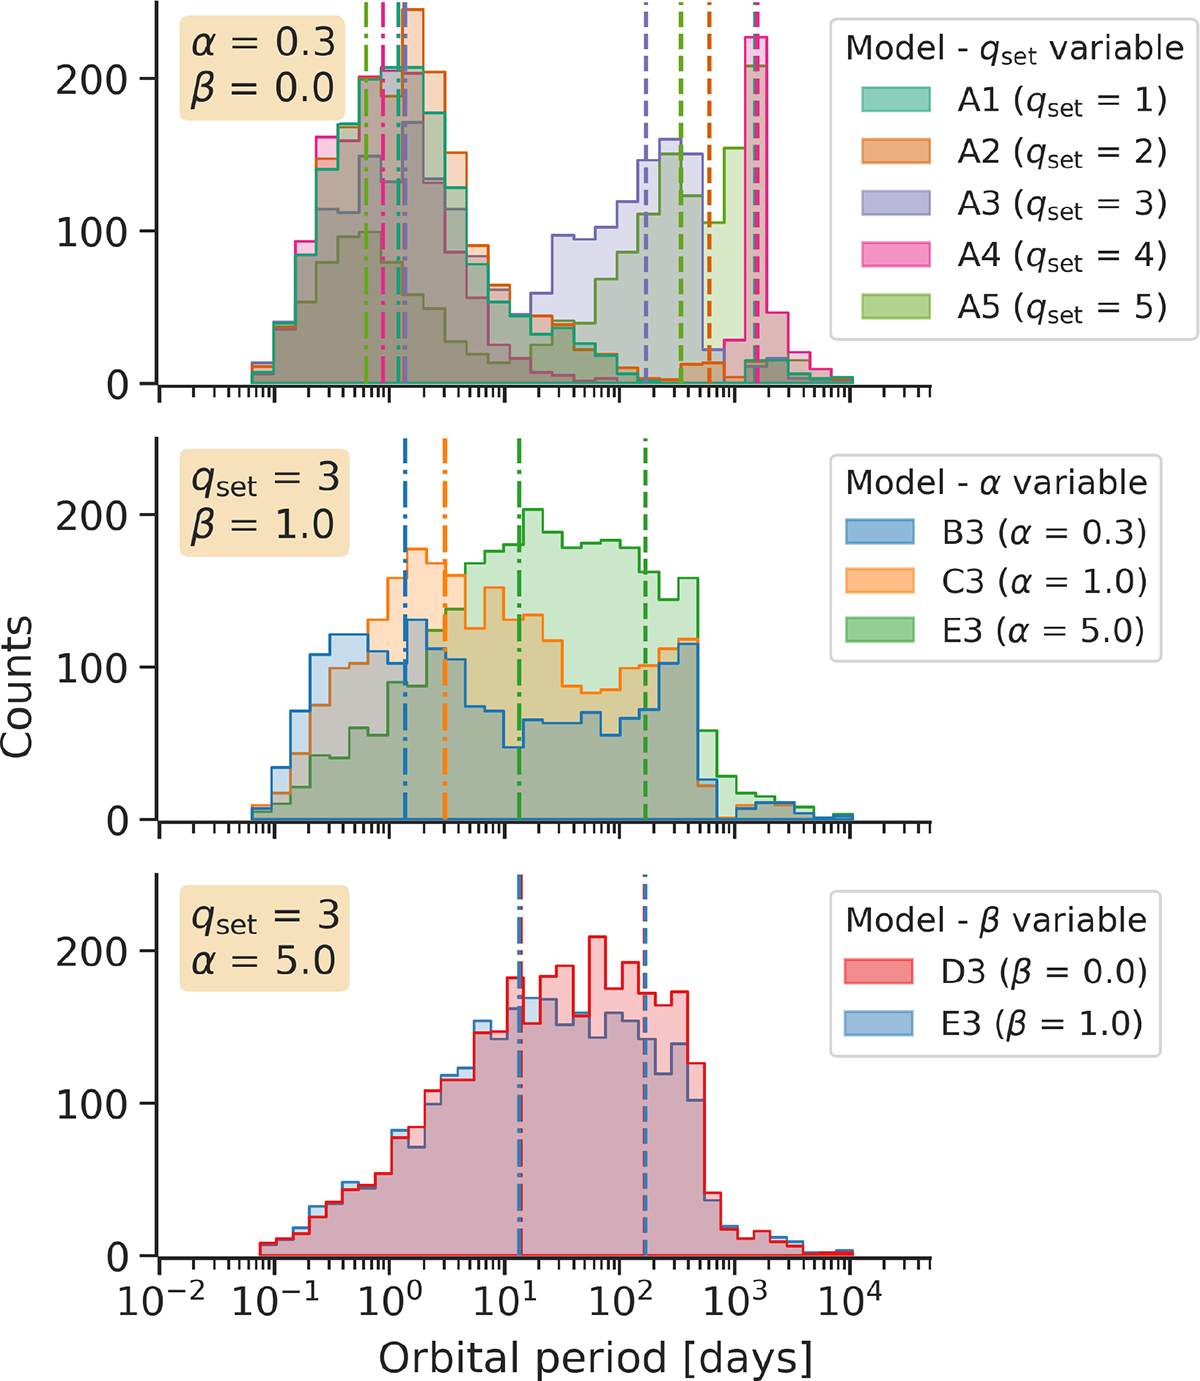
Fig. 4.
Download original image
Orbital period distribution of the WD+MS binaries that went through mass transfer, either stable or unstable, in our COSMIC models. The top panel shows the variation in the period distribution due to qcrit; middle panel shows the same, but due to α, and the bottom panel, due to β. The dashed lines show the median value of the period distribution considering only the stable mass transfer systems. The dash-dotted lines show the median period for the CEE systems. Values for the medians are shown in Table A.1. The largest changes in the period distribution occur when qset = 3, where the first ascension giant branch stars tend to have stable mass transfer, and qset = 5, where all giants are more stable. The main effect of increasing α is creating a post-CEE systems with larger periods, while the effect of β is nearly negligible.
Current usage metrics show cumulative count of Article Views (full-text article views including HTML views, PDF and ePub downloads, according to the available data) and Abstracts Views on Vision4Press platform.
Data correspond to usage on the plateform after 2015. The current usage metrics is available 48-96 hours after online publication and is updated daily on week days.
Initial download of the metrics may take a while.