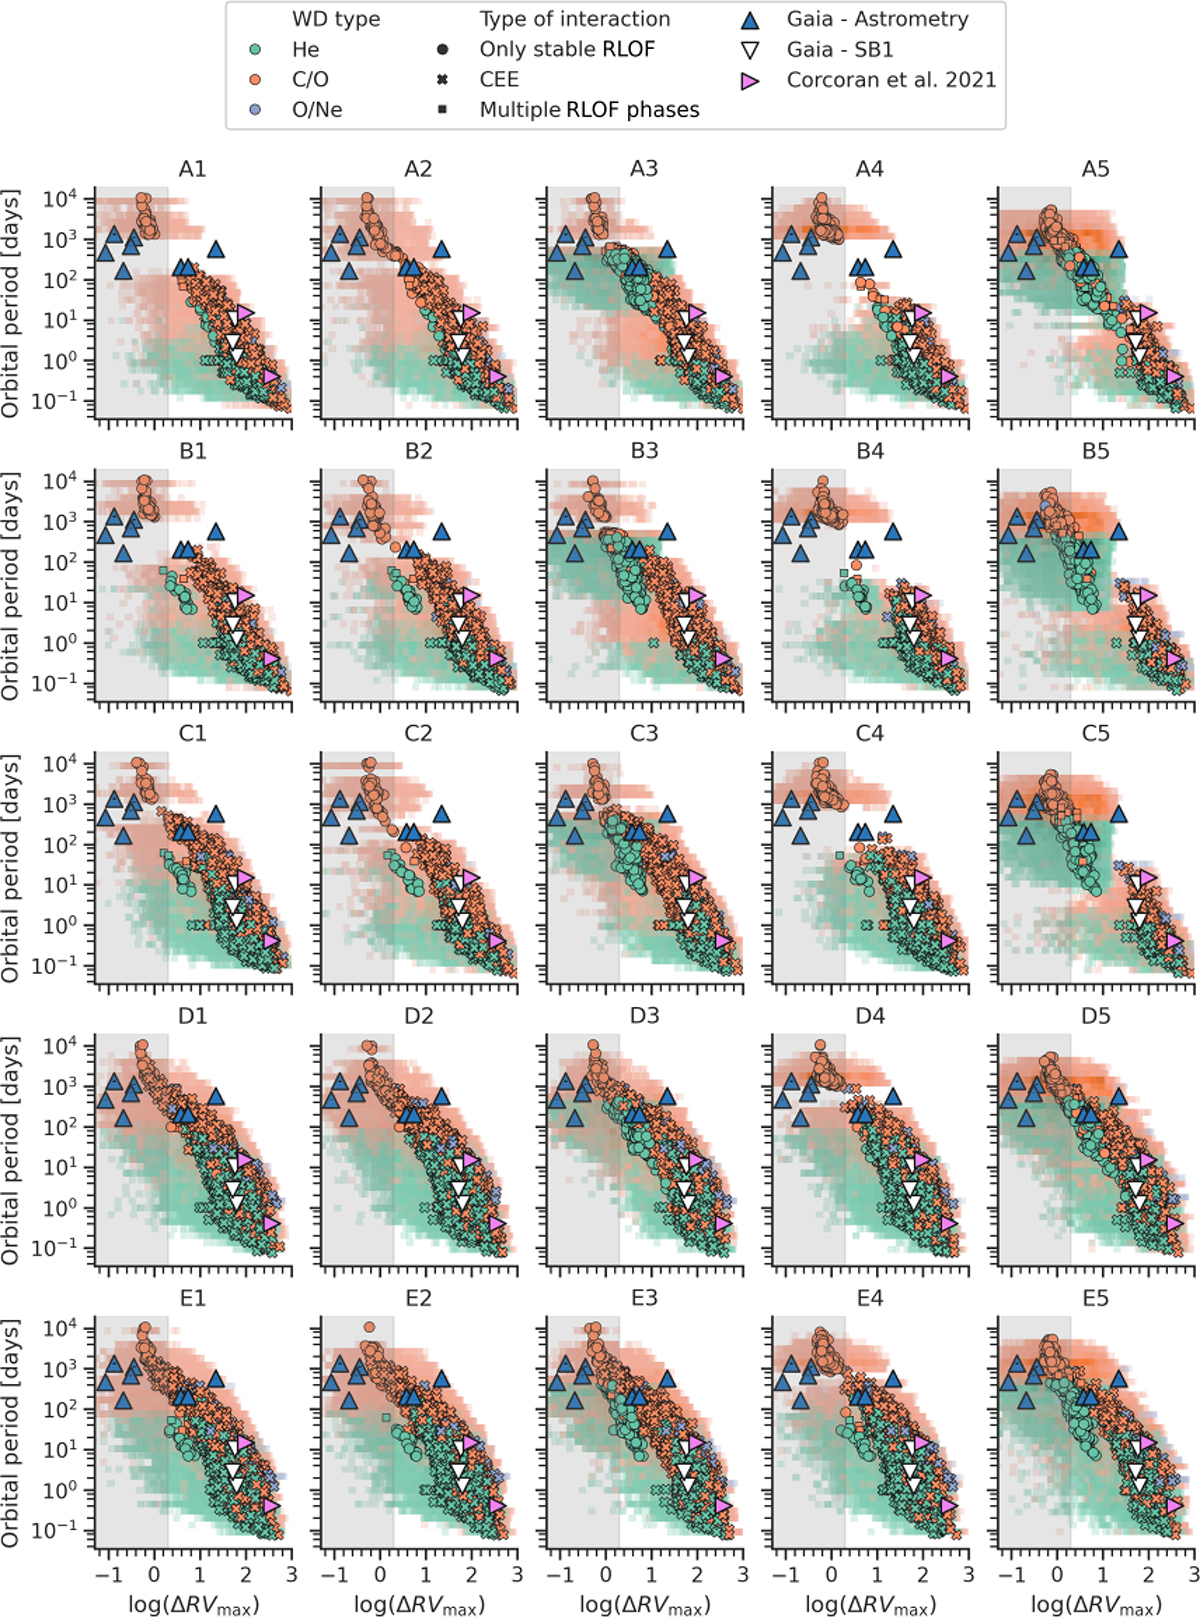
Fig. 6.
Download original image
Orbital periods and ΔRVmax for all models and observational data (triangles). Colors indicate the type of WD formed after mass transfer, and the markers indicate the type of mass transfer the system went through. Noninteracting systems are not shown. The shaded gray region indicates the region below ΔRVmax = 2km/s, where RV uncertainties dominate. The background squares show 2D log10-scaled histograms of all 100 MC realizations of the ΔRVmax distribution for each binary system in the model; the markers are the mean of the distribution for each binary. Models with qset = 3, models D and E and model A5 are the best matches to the data, showing more continuous period/ΔRVmax distributions.
Current usage metrics show cumulative count of Article Views (full-text article views including HTML views, PDF and ePub downloads, according to the available data) and Abstracts Views on Vision4Press platform.
Data correspond to usage on the plateform after 2015. The current usage metrics is available 48-96 hours after online publication and is updated daily on week days.
Initial download of the metrics may take a while.