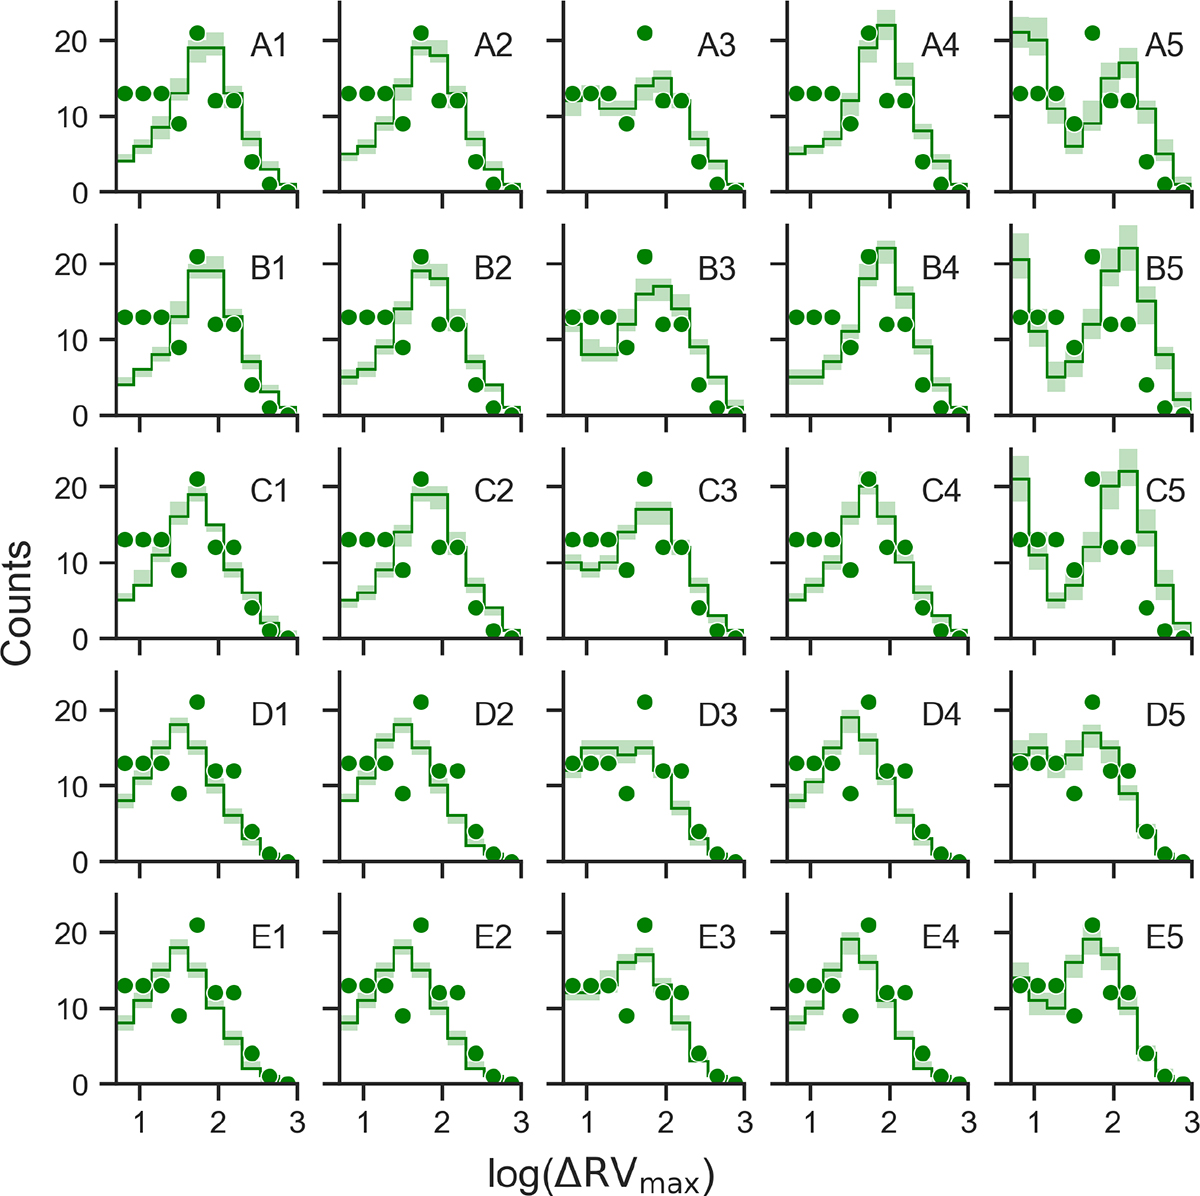
Fig. A.1.
Download original image
ΔRVmax histograms for 100 MC realizations for all 25 COSMIC models (light green blocks) and the AGGC ΔRVmax data (dots); the width of the blocks represents the 90% confidence region for each bin. The ΔRVmax distribution histograms cover the range from 5 to 1000 km/s, with 10 bins. Models with low α and qset ≠ [3,5] ([A,B,C][1,2,4]) tend to underestimate the number os systems with lower ΔRVmax, and overestimate the systems with high ΔRVmax; models with low α and qset = 5 greatly overestimate the number of systems with low ΔRVmax.
Current usage metrics show cumulative count of Article Views (full-text article views including HTML views, PDF and ePub downloads, according to the available data) and Abstracts Views on Vision4Press platform.
Data correspond to usage on the plateform after 2015. The current usage metrics is available 48-96 hours after online publication and is updated daily on week days.
Initial download of the metrics may take a while.