Fig. 5
Download original image
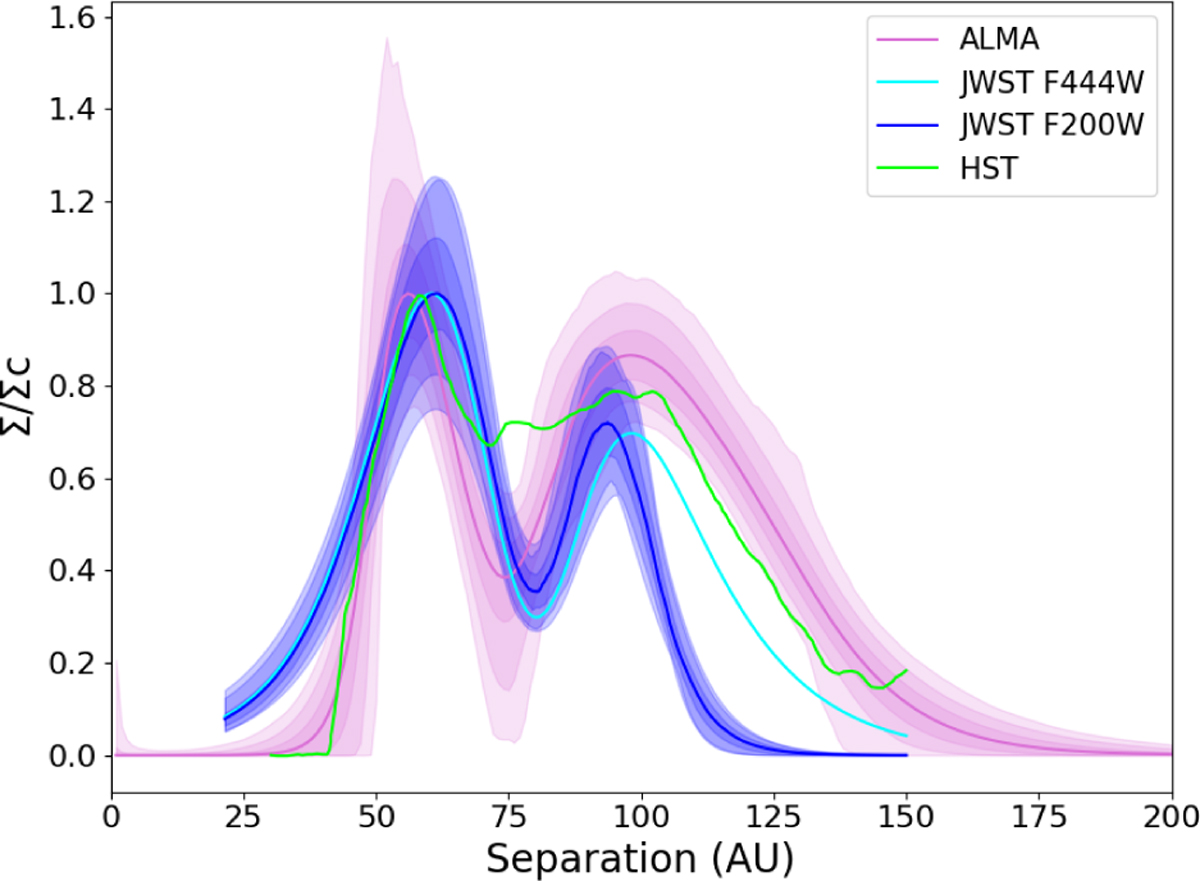
Radial density distribution of the dust obtained from PSF libray+mask modeling of F200W and F444W JWST data (dark blue and light blue curves) and comparison with ALMA (pink curves) and HST (green curve). For F200W JWST filter and ALMA, the solid line represents the median, while the shaded areas represent the 68, 95, and 99.7 per cent confidence regions as obtained by Marino (2021). F444W JWST profile was obtained using the mean parameters derived at 2 μm (column four of Table 2), with the exception of lout, set at 30. For HST, the curve is taken from Fig. 7 of Golimowski et al. (2011).
Current usage metrics show cumulative count of Article Views (full-text article views including HTML views, PDF and ePub downloads, according to the available data) and Abstracts Views on Vision4Press platform.
Data correspond to usage on the plateform after 2015. The current usage metrics is available 48-96 hours after online publication and is updated daily on week days.
Initial download of the metrics may take a while.