| Issue |
A&A
Volume 704, December 2025
|
|
|---|---|---|
| Article Number | A176 | |
| Number of page(s) | 16 | |
| Section | Planets, planetary systems, and small bodies | |
| DOI | https://doi.org/10.1051/0004-6361/202555602 | |
| Published online | 15 December 2025 | |
JWST/NIRCam observations of HD 92945 debris disk: An asymmetric disk with a gap
1
INAF, Astronomical Observatory of Padua, Vicolo dell’Osservatorio 5, 35122, Padua, Italy
2
Department of Physics and Astronomy, University of Exeter, Stocker Road, Exeter EX4 4QL, UK
3
NASA-Goddard Space Flight Center, Greenbelt, MD 20771, USA
4
Space Telescope Science Institute, 3700 San Martin Dr, Baltimore, MD 21218, USA
5
Centre for Exoplanets and Habitability, University of Warwick, Coventry CV4 7AL, UK
6
Department of Physics, University of Warwick, Coventry CV4 7AL, UK
7
Malaghan Institute of Medical Research, Gate 7, Victoria University, Kelburn Parade, Wellington, New Zealand
8
Univ. Grenoble Alpes, CNRS, IPAG, 38000 Grenoble, France
9
School of Mathematics and Physics, University of Queensland, St Lucia, QLD 4072, Australia
★ Corresponding author: This email address is being protected from spambots. You need JavaScript enabled to view it.
Received:
20
May
2025
Accepted:
30
October
2025
Abstract
Aims. We present the first observations of the HD 92945 debris disk obtained with the James Webb Space Telescope (JWST), targeting this nearby K0V star located at 21.54 pc from the Sun. The main objectives are to characterize the disk’s morphology in the near infrared, compare it with previous data from ALMA and HST, and place new constraints on the presence and properties of potential planetary companions shaping the disk.
Methods. High-contrast coronagraphic imaging was performed using JWST/NIRCam in the F200W and F444W filters. Advanced postprocessing techniques were employed, including reference differential imaging (RDI) with custom-built point spread function (PSF) libraries, and forward modeling of the disk using synthetic PSFs and MCMC optimization. After subtracting the disk contribution, the residuals were analyzed to identify candidate point sources. From these, we derived contrast curves and constructed detection probability maps for substellar companions.
Results. The disk is clearly detected in both NIRCam filters and reveals a broad, inclined structure with a gap, consistent with previous scattered-light and ALMA observations. The modeling confirms the presence of a gap at ∼80 au and shows a scale height and scattering properties compatible with a dynamically active disk. A significant brightness asymmetry is observed in the southwestern inner ring at both 2 and 4.4 μm, consistent with previous ALMA results. Observing this feature across different wavelengths and epochs strongly supports a scenario where one or more unseen planetary companions are perturbing the disk. No comoving sources are detected, and all candidate objects in the field are consistent with background stars or galaxies. The derived detection limits exclude planets more massive than ∼0.4-0.5 MJup beyond 100 au and more massive than ∼1 MJup beyond 20-40 au. This, in turn, rules out the possibility of a single planet placed beyond ∼ 20 au as responsible for the astrometric signal observed by Gaia. These results, combined with the observed disk features, support a scenario in which a single or multiple sub-Jupiter planets dynamically shape the system through mechanisms such as secular apsidal resonances, providing a coherent explanation for the gap, the asymmetric brightness distribution and the astrometric signal.
Key words: methods: data analysis / methods: observational / techniques: high angular resolution / techniques: image processing / Kuiper belt: general / planet-disk interactions
© The Authors 2025
 Open Access article, published by EDP Sciences, under the terms of the Creative Commons Attribution License (https://creativecommons.org/licenses/by/4.0), which permits unrestricted use, distribution, and reproduction in any medium, provided the original work is properly cited.
This article is published in open access under the Subscribe to Open model. This email address is being protected from spambots. You need JavaScript enabled to view it. to support open access publication.
1 Introduction
Direct imaging of exoplanets is emerging as a pivotal technique for advancing our understanding of planetary systems, particularly the outer extents of their architectures. This method, which isolates the faint light of a planet from its much brighter host star, is uniquely positioned not only to provide critical insights into planetary systems but also to outline the structures of circumstellar debris remnants of planetary formation.
Despite the potential of direct imaging, especially in the context of young, self-luminous planets, ground-based surveys have historically encountered significant challenges. Detection rates for young, widely separated planets have been lower than initially expected (Nielsen et al. 2020; Vigan et al. 2021). These results are now attributed to the rarity of such planets coupled with the limitations inherent in ground-based observations, such as bright speckles, generated by the atmospheric interference which dominate the noise close to the star where planets are more likely to be found.
Targeted searches using indicators such as structured circumstellar debris disks have been attempted in the past years (e.g., Meshkat et al. 2015, 2017; Dahlqvist et al. 2022; Tamura 2014), based on the idea that dynamical sculpting of these disks may be caused by unseen planetary companions. Features such as gaps, warps, asymmetries, or sharp edges can trace the presence of planets, making debris disk systems especially promising targets for direct imaging efforts. However, these surveys struggled to yield significant results, highlighting the complexities of predicting and identifying these distant worlds. In any case, features in disks, when detected and characterized, can help to put strong constraints on the mass and orbital parameters of hidden planets (see e.g., Tabeshian & Wiegert 2016; Marino et al. 2018; Yelverton & Kennedy 2018; Friebe et al. 2022; Sefilian et al. 2023; Pearce et al. 2024), especially in multiwavelength surveys.
The James Webb Space Telescope (JWST) offers a new eye on the sky, giving for the first time the chance of performing high-contrast imaging from space at both near and mid-infrared wavelengths, accessing the yet unexplored range of fainter and lower-mass directly imaged planets. The capabilities of this observatory were assessed during the ERS program (Hinkley et al. 2022; Carter et al. 2023) and were later confirmed through the detection of further faint and cold companions (see for example Lagrange et al. 2025; Matthews et al. 2024).
Moreover, JWST proved high sensitivity to faint debris disks, revealing details which are beyond the capabilities of previous telescopes. Striking examples of JWST’s capabilities include the observation of the debris disk around β Pictoris (Rebollido et al. 2024), revealing new structures in the disk-such as the “cat’s tail” - believed to result from radiation acting on small dust particles in the aftermath of collisions. Another example is the detection of small dust particles in the Fomalhaut system (Gáspár et al. 2023), resolved for the first time in the mid-infrared with the Mid-Infrared Imager (MIRI).
In this paper, we present the first images of the HD 92945 system observed with JWST with the Near-Infrared Camera (NIRCam). HD 92945 is a K0V spectral type star located at a distance of 21.54 ± 0.02 pc from the Sun (Gaia Collaboration 2021). Its age is estimated to be between 100 and 300 Myr (Song et al. 2004; Plavchan et al. 2009), with the possibility of being a member of the AB Dor stellar group, which has an estimated age of  Myr (Nielsen et al. 2019). Spectroscopic analysis provided an estimation of the stellar mass of 0.86 ± 0.01 M⊙ and of the stellar radius of 0.75 ± 0.02 R⊙ (Mesa et al. 2021). The debris disk around HD 92945 was initially identified due to its flux at 60 μm measured by IRAS (Silverstone 2000), significantly higher than the expected photospheric flux at that wavelength. Infrared spectroscopic observations with the Spitzer Space Telescope showed excess emission compared to the photospheric flux in the mid-infrared (Chen et al. 2005; Plavchan et al. 2009).
The Hubble Space Telescope (HST), equipped with the Advanced Camera for Surveys (ACS), provided the first resolved images of the disk in scattered light (observations acquired on 2004-12-01 and 2005-07-12, Golimowski et al. 2011). In the same work, Golimowski et al. (2011) also presented a detailed characterization of the disk, coupling the HST images with Spitzer’s photometric data at 24 and 70 μm. As a result, HD 92945 showed an axisymmetric and inclined disk, with an inner ring at 43-65 au from the star and an outer disk extending from 65 au, with a surface brightness that slowly declines with increasing radius and suddenly drops at 110 au.
Observations with the Atacama Large Millimeter/ submillimeter Array (ALMA) revealed further details about the structure of the disk at 0.86 mm. Analysis of the data showed a gap at  au, 27.6 au wide and with a fractional depth of
  (observations acquired on 2016-12-13/18, Marino et al. 2019; Marino 2021).
The Spectro-Polarimetric High-contrast Exoplanet REsearch (SPHERE, Beuzit et al. 2019) instrument at the Very Large Telescope (VLT) was used to obtain high-contrast images of the system in the near infrared. Observations did not reveal any disk features or planetary companion candidates (Mesa et al. 2021).
In Section 2, we describe the observations and data reduction procedures. Section 3 presents the results of the disk detection and forward modeling. In Sect. 4, we discuss the detection limits and contrast curves derived from the postprocessed images, along with the characterization of the point sources detected in the field. Finally, we summarize our findings and their implications in Section 5.
2 Observations and data reduction
HD 92945 was observed as part of program 3989 (PI: Hinkley, co-PI: Lazzoni, Marino). NIRCam observations were performed in date 2024-05-20 with the wideband filters F200W (λ = 1.988 μm, ∆λ = 0.461 μm) and F444W (λ = 4.402 μm, ∆λ = 1.024 μm) in coronagraphic mode (MASK335R). Details on the parameters adopted for this observation are given in Table 1. Based on early science results for the HIP65426 system (Carter et al. 2023), it was determined that, for this instrument, the angular differential imaging (ADI, Marois et al. 2006) technique is not as impactful as the Reference Differential Imaging (RDI, Lafrenière et al. 2009). Moreover, RDI only and the coupling of RDI+ADI yield very similar performances in terms of contrasts, indicating that ADI does not add relevant improvements to RDI for NIRCam observations. Consequently, only one scientific exposure was taken, and the RDI only technique was employed using a dedicated reference star (HD 92921) observed on the same date as HD 92945 (2024-05-20), with a five point small-grid dither pattern.
The data reduction was performed using the spaceKLIP pipeline (Kammerer et al. 2022; Carter et al. 2023), which provides a robust and tailored approach for processing NIRCam data, addressing the challenges of the instrument to facilitate accurate and reliable high-contrast imaging analysis.
spaceKLIP accepts as inputs the stage-0 (.uncal files) products of the JWST pipeline and performs dedicated preprocessing steps, including ramp fitting, background subtraction, bad pixel correction, alignment, and more, to address instrumentspecific effects. Following these steps, the pipeline generates PSF-subtracted images using, as a postprocessing method, the KLIP algorithm (e.g., Soummer et al. 2012). For HD 92945 reduction we explored Karhunen-Loeve (KL) modes 1, 2, 5, 10, 20. spaceKLIP also allows the calculation of contrast curves, which include the KLIP and mask throughputs (Adams & Wang 2020) and the small sample statistics correction (Mawet et al. 2014), and precise measurements of photometry and astrometry for any source in the field of view.
Figure 1 displays the final products of the pipeline for NIRCam F444W (left panel) and F200W (right panel) filters, obtained applying RDI using HD 92921 as reference and KL=10 for which the S/N was the highest. In the F444W filter, we note the presence of a background object with negative excess at ∆RA ~ 6.92″ and ∆Dec ~ 5.68″. This source is present in the reference star field of view and does not influence the scientific reduction. The characterization of the sources in the field of view is discussed in Section 4, while the disk modeling is addressed in the subsequent section.
When applying RDI, we either used the dedicated reference star HD 92921, or a more extensive library comprising reference stars acquired within program 3989 (HD 25945, HD 92921, HD 114642, HD 125161, HD 161915, HD 190580, and HD 197051). Some stars present few background objects which, generally, were faint enough not to affect the reduction. However, HD 190580 was excluded from the PSF library due to a bright source present in the field of view, which significantly impacted the performance of the library. In the single-reference RDI approach, only the five dithers of HD 92921 are used to construct a PSF model, yielding a maximum KL mode of 20. This allows for some diversity in the reference PSF while maintaining high spectral and photometric fidelity with respect to the target, reducing the risk of chromatic mismatches and preserving extended astrophysical signals. In contrast, the PSF library approach expands the reference set by including dithers from multiple reference stars enabling a broader exploration of PSF variability. This approach enables a higher range of KL modes (max KL modes = 457) which in turn allows for a more effective suppression of the stellar PSF while preserving the underlying astrophysical signal. The PSF library is initially constructed by collecting all available stage-0 files corresponding to suitable reference stars observed in program 3989. These files are then processed using spaceKLIP, as detailed in the previous section. After the preprocessing steps are completed, the final postprocessed products are obtained by subtracting from the science image an optimized combination of the PSF library images, selected to minimize the residuals. In the following, we demonstrate how leveraging, multiple reference stars improves the subtraction of central regions enhancing the signal of the disk around HD 92945.
Observation parameters.
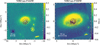 |
Fig. 1 NIRCam reductions for HD 92945 for the F444W (left panel) and the F200W (right panel) filters. Both images where obtained performing RDI with HD 92921 as reference. The images are rotated to northeast, with the scale bar in the bottom left corner representing a projected distance of 50 au. |
3 Modeling and characterization of the disk
The disk around HD 92945 is detected at both 4.4 and 2 μm with the NIRCam instrument. In this Section, we aim to model the disk in the F200W and F444W filters, then subtract it and reveal potential faint sources obscured by the disk’s glare.
For disk modeling and subtraction, we utilized the Python package Winnie (Lawson et al. 2022, 2023), which provides tools for disk model convolution using synthetic PSF grids, customized RDI implementations, and forward modeling for RDI. The disk model used by Winnie is based on the scat-tered_light_disk() function provided by the vip_hci package (Gomez Gonzalez et al. 2017). This function offers a simplified version of the GRaTer code (Augereau et al. 1999), modeling the radial distribution of dust as a smoothed two-power-law profile for a single-ring disk, combined with a linear combination of two Henyey-Greenstein (HG) phase functions to represent the forward and backward scattering of light by the dust.
However, HD 92945’s disk has several features, already identified in previous analyses, both in scattered light with HST and at submillimeter wavelengths with ALMA, that may require a more complicated model. Thus, to achieve a more detailed characterization, we adopted the same functional form used to model the surface density when modeling the ALMA data, incorporating a broad disk component with an embedded gap. The density distribution is described by the following equation
 (1)
(1)
with h being the disk’s scale height and Σ(r) the radial distribution, defined as in Marino (2021):
 (2)
(2)
Here, rin and rout represent the inner and outer radii, γ the inner surface density slope, lin and lout control the steepness of the inner and outer edges, and Σc is normalized to 1 at the reference radius. Finally, fg models the gap as a Gaussian function
 (3)
(3)
where δg represents the gap depth, rg the gap radius, and the full width at half maximum is defined as  .
.
The model described above was then implemented within the scattered_light_disk() function to reproduce the more complex density distribution of the dust expected for HD 92945. To estimate the forward and backward scattering of dust particles, instead, we employed the same two-HG phase function provided by scattered_light_disk().
For both filters, the raw model of the disk obtained with our customized function was convolved within Winnie with a JWST PSF calculated using the STPSF package and rotated to match the position angle of the science acquisition. Next, an RDI reduction was performed, either with a single PSF or with the PSF library as described in Section 2.1, on the science image and on the convolved model, and the residuals were obtained by subtracting the two.
Disk parameters for HD 92945.
3.1 F200W filter
To constrain the disk parameters and associated uncertainties at 2 μm, where we are able to pierce closer to the star thanks to the smaller pixel scale (0.031 arcsec/pixel), we used a Markov Chain Monte Carlo (MCMC) sampling of the posterior distribution with the emcee Python package (Foreman-Mackey et al. 2013). The log-likelihood function was calculated based on the χ2 of the residuals after subtracting an RDI-processed image of the convolved model from an RDI-processed image of the science data. The 15 parameters varied during the optimization were rin, rout, γ, lin, lout, δg, rg, wg, h, position angle, inclination, the forward (g1 > 0) and backward (g2 < 0) scattering coefficients, the weight of the two HG coefficients (wg1 and wg2 = 1 - wg), and the peak surface brightness of the disk (F). We considered projected radii in the range [1,4.8] arcsec to exclude the central oversubtracted area and sources at the field edge. The MCMC simulation ran for 4000 iterations with 50 walkers. To analyze the results, we discarded the first 1500 burn-in steps and applied a thinning factor of 100 to reduce correlations between steps.
We retrieve a model for the disk in both cases where we used either a single reference PSF or the entire library for the RDI. The second and third columns of Table 2 list the median values and the 16th and 84th percentiles for each of the 15 parameters as obtained for one and multiple reference stars, respectively. An image of the disk, the model, and the residual as given by both simulations is shown in Figure 2, where the models were obtained using the mean parameters listed in Table 2.
The PSF library proved to be more effective in producing a model closer to the data, as proven by the contrast curves derived in Section 4.2. However, some of the parameters differ significantly from what was obtained with the same model in the submillimeter with ALMA (see last column of Table 2). This is especially true for the inner and outer slopes of the disk, lin and lout, which differ by 5 and 2 σ, respectively, from the values obtained from ALMA data. A potential source of bias could be the parameterization of the phase function that we assumed. Thus, to mitigate this potential bias, we applied a butterfly-shaped mask, oriented along the position angle (−79°) with an opening angle of ±30°, to exclude from consideration the disk’s bright region near the minor axis (see last row of Figure 2). We then reran the MCMC simulation on the masked images with the same settings described previously.
Only the PSF library was taken into account in this case given the better subtraction achieved. Results are shown in the fourth column of Table 2 and in the last row of Figure 2. The derived parameters do not differ significantly from those obtained in previous simulations-whether using a single reference star or the PSF library-but they show improved agreement with the ALMA results. Notably, we recovered a higher disk inclination (64.9° ± 0.4°), which aligns remarkably well with its submillimeter counterpart (65.4° ± 0.6°). This parameter serves as a valuable benchmark for assessing the quality of our modeling, as it is largely wavelength-independent and can be directly compared with the high-precision measurements provided by ALMA.
Finally, we highlight a surface brightness asymmetry in the southwestern portion of the inner disk component that is discussed in details in Section 3.3. For the discussion in Section 3.3, we adopt the parameters of the disk retrieved from this last modeling to compare the disk characteristics at different wavelengths while we use the residuals shown in the second row of Figure 2 for source vetting and to calculate contrast curves in Section 4. Moreover, the corner plot presented in Figure A.1 refers to the modeling of masked images.
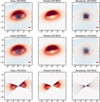 |
Fig. 2 F200W data, model, and residuals of HD 92945’s disk using one reference, HD 92921, (top panels) and the PSF library considering the entire image (second row) or excluding the bright regions close to the minor axis (last row). |
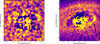 |
Fig. 3 Smoothed images of the residuals obtained after modeling and subtracting the disk in the F444W (left panel) and F200W (right panel) filters. The disk luminosity asymmetry detected in both filters in the west portion of the disk is pointed by the arrow. For the both filters, we also added the 2 × 10⁻⁴ Jy/beam contour level from ALMA data (Marino et al. 2019). |
3.2 F444W filter
Due to the lower spatial resolution imposed by the NIRCam pixel scale at 4 μm (0.062″/pixel versus 0.031″/pixel at 2 μm), and especially due to the larger PSF (2.2 times larger in the F444W filter than in the F200W), the disk’s fine structures are more difficult to constrain compared to the 2 μm data. To overcome this limitation, we generated a disk model at 4 μm by adopting the morphological parameters derived from the F200W filter, where the resolution is higher and the disk structure better resolved.
We began by varying only the parameters that are strongly wavelength dependent, namely those governing the scattering phase function (g1, g2, wg1 ) and the peak surface brightness (F). The remaining 12 parameters were initially fixed to the average values listed in Table 2, either from column two (single reference PSF) or column three (PSF library). The best-fit values for the four wavelength-dependent parameters were then obtained through a non-linear least-squares χ2 minimization of the residuals.
As done for the F200W filter, we computed two separate models at 4 μm, one using a single reference PSF and the other based on the full PSF library employed in the RDI process. To mitigate contamination from unrelated sources, the optimization excluded the three bright compact sources identified in the field (C2, C3, and C4, see Section 4), and considered only regions within 8″ of the star to avoid the neutral density squares in the corners.
The resulting models are shown in the first two rows of Figure 4. In both cases, the models reproduce the observed disk well, suggesting a radial profile consistent with the one derived at 2 μm. However, residual emission is visible in the northern part of the image, near the semiminor axis. We explored whether adjusting the remaining 12 parameters could reduce these residuals and found that increasing the parameter that regulates the steepness of the outer edge, lout, improved the fit significantly. This was obtained again through a non-linear least-squares χ2 minimization of the residuals. This behavior is consistent with ALMA observations and likely reflects the improved modeling of the outer disk regions, which are better captured at 4 μm thanks to the wider field of view. For both the single reference and PSF library cases, values of lout ∼ 28-30 were required to minimize residuals. These refined models are presented in the third and fourth rows of Figure 4.
As noticed for the F200W filter, the use of the PSF library provides a cleaner residual image, particularly in the central regions. In fact, residual of over and undersubtractions that are visible in the central area in the right panels of the first and third rows, are strongly mitigated when considering multiple PSFs (right panels of second and last rows). These artifacts likely arise from slight misalignments between the science and reference images, potentially caused by the bright northern region of the disk biasing the estimated stellar centroid. When using a PSF library, the subtraction algorithm effectively builds a synthetic reference PSF from a combination of many reference frames. This linear combination can better reproduce the actual centroid shift and speckle morphology of the science frame.
3.3 Comparison with ALMA and HST
Our HD 92945’s disk modeling results at 2 and 4.4 μm show a morphology that is qualitatively similar to that found with ALMA and HST, that is a wide disk with a gap. In this Section we discuss their similarities and differences.
First, and as expected, the disk orientation that we find at 2 μm agrees with that found at 0.59-0.8 μm (ACS/HST, Golimowski et al. 2011) and at 0.86 mm (Marino et al. 2019, ALMA,). The disk’s scale height h in the near infrared, on the other hand, is nearly twice that measured for larger grains with ALMA ( versus
  ). Although the two estimates are consistent within 2σ, the discrepancy can be attributed to underlying physical processes. The scale height of planetesimals and their general orbital excitation is thought to be set by gravitational interactions with planets (e.g., Mustill & Wyatt 2009) or disk self-stirring (e.g., Krivov & Booth 2018). The micron-size dust grains, detected at near infrared wavelengths, are also subject to radiation pressure that could play a role in increasing their eccentricities and inclinations (Thébault 2009), therefore increasing the scale height of the disk as seen at 2 μm.
Figure 5 illustrates in shades of blue the radial density distribution of the dust as obtained analyzing NIRCam F200W (dark blue) and F444W (light blue) filters and their comparison with previous results from ALMA in the submillimeter (shades of pink, Marino 2021) and HST at 0.59 and 0.83 μm (green, adapted from Golimowski et al. 2011).
For ALMA (pink) and 2 μm JWST (blue) data, the solid line represents the median, while the shaded areas represent the 68, 95, and 99.7 per cent confidence regions. We note that the 4 μm profile is only qualitative, as the F444W images do not provide sufficient spatial resolution to perform a reliable optimization of the disk at this wavelength. As discussed in the previous Section, we therefore adopted the mean parameters derived at 2 μm (column four of Table 2), with the exception of lout , which was set to 30. The 4 μm results are not included in the subsequent discussion. Finally, since both the ALMA and JWST data were modeled using the same functional form, the comparison between the results from this work and those at submillimeter wavelengths presented by Marino (2021) is more robust than comparisons between JWST and HST models outcomes.
As given by the best-fit results presented in the fourth column of Table 2, the inner and outer edges of the disk are placed at  au and
  au. These results can be compared with what was found by Golimowski et al. (2011) in HST data, where HD 92945’s disk was modeled using two separate components, the inner one located between 43-65 au and the outer one placed between 65-145 au, with a steep decrease in the surface brightness of the latter starting from 110 au. Considering the full extent of the disk, defined where the profiles in Figure 5 drop to 90% below the peak density, the disk appears shifted inward by approximately 20 au at 2 μm (extending from ∼25 to ∼112 au) compared to shorter HST wavelengths (extending from 43 to 145 au).
The different width of the inner portion of the disk at 2 and 0.59-0.83 μm might arise from residuals left in the JWST data after PSF subtraction, affecting the retrieval of the density profile close to the star. A combination of the limited field of view (∼100 au at 2 μm) and the faintness of the outer portion of the disk could also explain the apparent inward shift of the outer edge seen in the JWST data with respect to the HST images. Although uncertainties for the HST-derived profile are not provided, it is likely that the two datasets are consistent within the expected uncertainties, especially when considering the limitations mentioned above.
From ALMA images, instead, the inner and outer edges are placed at  and
and  au, respectively. Once more, the disk looks less extended in its outer regions at 2μm than in the submillimeter images. Although our estimates agree with the ALMA model within 2.1 and 2.7 σ for the inner and outer disk radii, respectively, these differences may arise from the distinct dust populations probed at submillimeter and micron wavelengths. Moreover, when comparing the peaks of the radial density distribution for the inner and outer components at 2 μm (
 au and
  au), we observe outward and inward shifts, respectively, relative to ALMA’s profile, which reports values of
  au and
  au. We also note that these shifts cannot be attributed to gas drag, as no gas has been detected in the disk of HD 92945 and upper limits on the 12CO gas mass were placed at 3 × 10⁻⁵ M⊕ (Marino et al. 2019). This implies that if gas is present it is not sufficient to influence the dust distribution.
Another mechanism that may explain differences between the spatial distribution of small and large grains is radiation pressure. However, for HD 92945’s low luminosity (0.37 L⊙, Matrà et al. 2025), radiation pressure is not strong enough to remove the smallest grains (Kirchschlager & Wolf 2013). Alternatively, stellar wind drag could be more important and explain the tentative grain size segregation (Plavchan et al. 2009).
As shown in Figure 5, the inner and outer slopes of the disk differ in 2 μm JWST data with respect to ALMA and HST models. In fact at 2 μm, lin/rin and lout/rout, which control how smooth or sharp the inner and outer edge are, appear more shallow in the inner regions of the disk and steeper at its outer extents, with values of  and
and  , respectively. This is the opposite of what was found with ALMA, for which
  and
and  . However, the values derived at 2 μm and with ALMA differ marginally by 3.3 and 1.4 σ, respectively.
In particular, the discrepancy in the outer slope may be attributed to limitations of the NIRCam field of view at 2 μm, as previously discussed. This interpretation is further supported by the modeling at 4.4 μm, where the field of view extends well beyond 150 au and the derived outer slope is significantly shallower than at 2 μm. At this wavelength, the dust density profile shows a much closer agreement with the ALMA and HST results for the outer disk, as illustrated by the light-blue curve in Figure 5.
The gap parameters are mostly comparable for JWST and ALMA, although the central radius of the gap (i.e., where the surface density minimum is) is slightly shifted outward in the 2 μm data, at  au compared to the
  au retrieved in the submillimeter, which corresponds to a 3 σ difference between the two estimates. This result might once more be related to the challenges of modeling the broad and faint outer component in a limited field of view. Regarding the gap depth (δg), instead, we may expect that Pointing-Robertson (PR) drag could push dust toward the gap, making δg smaller (i.e., a shallower gap) at this wavelength than in submillimeter. Nevertheless, the two δg are comparable, pointing to an efficient dust removal process or gap clearing on timescales shorter than PR drag.
Finally, we highlight a surface brightness asymmetry in the southwestern portion of the inner disk component. The asymmetry is detected both at 4.4 μm, although marginally, and at 2 μm. In Figure 6 we quantify such asymmetry for the F200W filter. The Figure shows the de-projected radial profile of the disk obtained taking two equivalent wedges with an aperture of ±30° along the semimajor axis on the left (eastern) and right (western) sides of the disk. The green profile was calculated on the images where the disk was present whereas the red one is estimated on disk-subtracted images. At ∼57 au, roughly compatible with the position of the inner edge of the disk, we estimate that the western side of the disk is 10% brighter than the eastern side.
This asymmetry closely resembles an asymmetry previously observed in the ALMA data at 0.86 mm and published in Marino et al. (2019). This is shown in Figure 3, where we superimposed on the JWST images the 2 × 10⁻⁴ Jy/beam contour which identifies the brightest portion of the disk as seen by ALMA. The overlap of the asymmetry identified in ALMA and NIRCam observations is particularly evident at 2 μm (right panel). This feature was probably already detected in HST data acquired with the F606W filter. Infact, looking at Figure 4 of Golimowski et al. (2011), we can notice that the western side of the disk is brighter that the eastern side between 50 and 60 au, at separations comparable with what found by ALMA and NIRCam.
In Marino et al. (2019), the authors discuss different origins for the disc asymmetry. One considers the asymmetry and the gap in the disk to be produced by the interaction with one or more planets. In particular, the secular apsidal resonance model, in which two planets interior to the disk carve a gap via secular interactions, could explain both the presence of the gap and the asymmetry observed with ALMA. However, they also raised the possibility that the apparent asymmetry in the ALMA data could be due to a background object, such as a submillimeter galaxy.
The detection of this asymmetry in JWST data at multiple wavelengths (F444W and F200W) and at a different epoch provides strong evidence that this feature is intrinsic to the disk structure. While the possibility of a background contaminant must be considered, several arguments disfavor this scenario. First, the location and morphology of the feature are aligned with the disk’s semimajor axis and appear smoothly connected to the inner edge of the belt, which would be highly coincidental for a background source. Moreover, if this feature was caused by a background source, it would have moved significantly in the 8 yr between the ALMA and JWST observations. Accounting for the proper motion of HD 92945, the suggested source in the ALMA image should be observed at present days at ∆RA = 0.5″ and ∆Dec = -0.6″, significantly far from the detected asymmetry in the NIRCam data. Moreover, since no source is detected at the aforementioned position, we can confirm that the asymmetry detected in the ALMA image is actually associated with an intrinsic disk feature.
Therefore, the new JWST observations presented here strongly support the interpretation that HD 92945’s gap and asymmetry could be caused via secular interactions between one or two planets and the disc (Yelverton & Kennedy 2018; Marino et al. 2019; Sefilian et al. 2023).
In summary, the morphology of the HD 92945 disk observed at near infrared wavelengths with JWST and HST, and at submillimeter wavelengths with ALMA, shows remarkable consistency. This agreement is especially noteworthy between JWST and ALMA, as both datasets were modeled using the same underlying radial density profile. Most of the derived disk parameters agree within 3 σ, with the majority falling within 2 σ.
The main discrepancy arises in the characterization of the outer regions of the disk. Despite this, the overall agreement between the datasets reinforces the robustness of the derived disk morphology and highlights the importance of multiwavelength modeling in tracing the spatial distribution of dust grain populations.
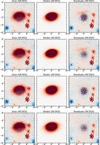 |
Fig. 4 From left to right, F444W data, model, and residuals of HD 92945’s disk using: (a) the same morphological parameters adopted for the disk as seen at 2 μm and one reference, HD 92921, (first row) or the PSF library (second row); (b) the same morphological parameters adopted at 2 μm with the exception of lout, optimized for these data, using the same single reference, (mid-bottom panels) or the PSF library (bottom panels). |
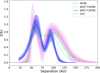 |
Fig. 5 Radial density distribution of the dust obtained from PSF libray+mask modeling of F200W and F444W JWST data (dark blue and light blue curves) and comparison with ALMA (pink curves) and HST (green curve). For F200W JWST filter and ALMA, the solid line represents the median, while the shaded areas represent the 68, 95, and 99.7 per cent confidence regions as obtained by Marino (2021). F444W JWST profile was obtained using the mean parameters derived at 2 μm (column four of Table 2), with the exception of lout, set at 30. For HST, the curve is taken from Fig. 7 of Golimowski et al. (2011). |
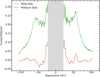 |
Fig. 6 Deprojected radial profile at 2 μm before (green curves) and after (red curves) disk model subtraction. The grey area represents the 1 arcsec region excluded from the modeling. |
4 Constraints on the presence of planets
4.1 Candidates vetting
After modeling and subtracting the disk from the two NIRCam filters, we examined the presence of sources in the field of view. As shown in Figure 7, there are multiple candidates found in each filter (named Cx with x=1,2,3,4,5,6). F444W presents candidates 1 to 6, with C1 only marginally in the field of view, while only the closer ones, C2 and marginally C3, are detected at 2 μm. No further point sources were detected after the subtraction of the disk.
By tracing back the proper motion of HD 92945 and comparing with data from Gaia DR3 (Gaia Collaboration 2021), as well as ALMA (Marino et al. 2019) and HST images (Schneider et al. 2014), we evaluated whether the observed candidates are consistent with being background objects. Only C1, C2, and C3 have previously detected counterparts in archival observations (ALMA and HST), placing these sources as being consistent with background objects. Searching through the Gaia archive, only the star Gaia DR3 5455707157212258048 is found within a 20″ radius of HD 92945, which when accounting for the proper motion of HD 92945, is found to be within ∼0.6″ of the location of C4. The lack of position overlap could be due to the missing proper motion value for the Gaia DR3 star. C5 and C6 have no archival counterparts.
To investigate the nature of the observed candidates, we performed PSF fitting for the sources fully contained within the NIRCam field of view, specifically, C2, C4, C5, and C6 in the F444W data and C3 in both the F200W and F444W data. For this purpose, we used the extract_companions() function provided by spaceKLIP, which generates a forward model of a point-like PSF based on the host star’s spectral type and photometry to simulate a realistic PSF, aiding in the retrieval of the sources’ astrometry and photometry. A recent feature of spaceKLIP also allows for the convolution of the synthetic PSF, which can improve modeling of extended sources. Specifically, we employed the Powell minimization method from the Python package scipy, convolving the PSF with a 2D Gaussian. It is expected that point-like sources are attributed to planetary candidates or background stars, when more extended sources would be more likely to be background galaxies.
Figures B.1 and B.2 show the best-fit results obtained using a point-like forward model (left column) and a convolved extended PSF (right column). Based on the observed fits, the majority of the detected sources appear to be extended (C2, C3, C5, C6). A visual analysis of the residuals indicates that C2 and C5 are best modeled with an extended PSF, as reflected in the broader, more diffuse structure of their best-fit models. Although less pronounced, C3 also appears more consistent with an extended source, given the oversubtraction in the F444W residuals (second row, left column of Figure B.1) and the spread residuals remaining in the F200W images (left column of Figure B.2). Although C6 does not exhibit significant differences between the forward and convolved models, nor in the residuals, the standard deviations computed from the residual images show a general improvement when convolving the PSF with a 2D Gaussian.
C4 is most likely the only point-like object in the HD 92945 field of view, as shown by the lack of blurring in the mid-panel of the right column in the third row of Figure B.1. However, the best-fit retrieved when using a convolved model results in a 2D Gaussian extended along the y-axis (see Table 3). This outcome may arise from discrepancies between the synthetic PSF and the actual source being subtracted.
Table 3 lists the parameters retrieved for each object. The second and third columns show the coordinates of the sources, given as relative right ascension (∆RA) and declination (∆Dec). The fourth column provides the contrast, in units of magnitudes, relative to the star, where  and
and  , as given by the extract_companions() function. We note that these three parameters, ∆RA, ∆Dec, and magnitudes, are the same for both fitting procedures. The fifth and sixth columns report the standard deviations computed from the residual images shown in the left and right columns of Figures B.1 and B.2. Finally, the last columns present the best-fit parameters for the 2D Gaussian: σx, σy, and the rotation angle θ. Additionally, we included a final entry, assessing whether each source is extended (C2, C3, and C5) or point-like (C4). C6 is likely a background galaxy, although too faint to be properly characterized and modeled.
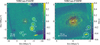 |
Fig. 7 Candidates in the field of view of NIRCam F444W (left panel) and F200W (right panel) as seen after the subtraction of the disk via the modeling. Candidates are encircled in white and named Cx with x=1,2,3,4,5,6. The scale bar in the bottom left corner represents a projected distance of 50 au. |
4.2 Contrast curves
Figure 8 presents the contrast curves and detection limits obtained for the two NIRCam filters, both in the presence of the disk (pink curves) and after disk subtraction (blue curves). Moreover, we show the contrasts derived using one reference (solid lines) or the PSF library (dashed lines). The contrasts were computed using the raw_contrast() function from the spaceKLIP package, applied to the outputs generated by the Winnie pipeline (Lawson et al. 2023, 2024). In spaceKLIP, raw contrasts are computed following the standard procedure of measuring the variance in pixel values within narrow annuli centered on the corresponding radial separation and then correcting these measurements to account for small sample statistics (Mawet et al. 2014). For data where the disk was present, the contrast was calculated on an image processed with the model constrained reference differential imaging (MCRDI) algorithm (Lawson et al. 2022), while to calculate the contrast in the absence of the disk, we used the corresponding disk-subtracted image. Of these, the latter should be considered to be more representative of the true sensitivity of the data - as the azimuthal brightness variations from the disk serve to artificially inflate the measured noise levels in the former. The contrast performance, in both cases, takes into account the throughput of the coronagraph. Conventionally, these raw contrasts would then be corrected for flux loss resulting from stellar PSF-subtraction by injecting point sources at various positions and then assessing peak throughput following PSF-subtraction as a function of stellocentric separation. However, using MCRDI, throughput loss for any point sources could be avoided simply by including the source in the model of the circumstellar scene (noting that sources outside the PSF optimization region cannot induce oversubtraction). It is therefore common to adopt contrast curves assuming full algorithmic throughput for MCRDI results (e.g., Lawson et al. 2023). As a comparison, we also added to the plot the contrasts estimate obtained with PanCAKE, a simulation tool that extends the official JWST exposure time calculator (Pandeia) to produce more accurate predictions of JWST coronagraphic performance (Carter et al. 2021). We note that this simulation tool can only use one reference (HD 92921 in our case) to estimate the con-strasts. Unsuprisingly, PanCAKE predicts better contrasts within 0.5″. This is likely related to the photon noise introduced by the disk that cannot be accounted for by PanCAKE. At wider separations, Pancake predictions for both filters align with the contrast obtained with a single reference after disk subtraction but they are outperformed when using the PSF library. As already noted from a visual investigation of the images, we confirm that the use of a PSF library significantly improves the contrasts with respect to the single reference case, in both cases where the disk is present, and especially, after modeling and subtraction.
The contrast limits were subsequently converted into planetary masses using a combination of chemical equilibrium, cloud-free models from ATMO (Phillips et al. 2020) and BEX (Linder et al. 2019), following the methodology described in Carter et al. (2021). We use the MADYS package1 (Squicciarini & Bonavita 2022) to convert from contrast to mass using the bex-atmo2023-ceq evolutionary model. For these conversions, the age of the system is fixed to 200 Myr (Song et al. 2004; Plavchan et al. 2009). It is important to note, however, that cloud formation and chemical disequilibrium likely play a significant role in shaping the emission spectra of substellar atmospheres, and may affect the inferred mass limits. This was, for example, the case for TWA 7b (Lagrange et al. 2025; Crotts et al. 2025), whose characterization, combining JWST/MIRI and JWST/NIRCam data, required the inclusion of water clouds and high atmospheric metallicity to reproduce the observed mid-infrared flux, highlighting the limitations of cloud-free equilibrium models for young, sub-Jupiter mass planets. Detection limits for F444W filter (top) and F200W (bottom) are shown in the right panels of Figure 8.
The gain in contrast and, consequently, in planet’s mass that can be detected when subtracting the disk is significant at both wavelengths, taking to a maximum gain of ∼0.5 MJup (∼8.9 MJup) beyond (within) 1 arcsec at 4 μm and ∼ 1.4 MJup at 2 μm, when using the PSF library. For example, for the F444W filter at ∼25 au, the minimum detectable masses are ∼1.2 MJup and ∼0.7 MJup before and after disk subtraction, with a gain of ∼0.5 MJup. At the same separation, with the F200W filter instead, the gain is ∼1.4 MJup, going from ∼7.1 MJup to ∼5.7 MJup minimum detectable mass. We also note that the term “gain” might not be accurate in this context. This is because the disk emission behaves like an additional noise source when searching for the faint signal of a planet. Therefore, subtracting the disk does not significantly enhance the intrinsic contrast, but rather improves the accuracy of the noise estimation, leading to more reliable detection limits.
In Figure 9, we show the detection probability maps (DPMs) for both filters, calculated combining both MADYS and ExoDMC (Bonavita 2020). Detection probabilities for planets from this study are shown in shades of blue and were calculated in the following way: a grid of masses ([0.1,100] MJup) and semimajor axis ([0.1,10] arcsec) was generated and at each point of this grid was attributed a number of orbital phases azimuthally distributed. For each configuration, the separation of the planet was then projected taking into account the inclination of the system. The planetary eccentricity is drawn from a broken Gaussian distribution centered at zero with a standard deviation of 0.1. This choice reflects the assumption that highly eccentric planets are unlikely to be present in the system, as such orbits would likely induce measurable eccentricity in the disk, which is not observed. The mass of the planet was then converted into contrast assuming an age for the system and the bex-atmo2023-ceq evolutionary model from MADYS. At each projected separations, the calculated contrast is compared to the 1D contrast curve (PSF library + disk subtracted) shown in Figure 8. The planet is considered detected if its contrast is above such curve. Moreover, these steps were repeated sampling the different ages taken in the range [100,300] Myr. The final detection probability for each combination of mass and semimajor axis was computed as the fraction of configurations that resulted in successful detections.
The white, grey, and black contours in Figure 9, associated with JWST/NIRCam detection probability, represent the 90, 50, and 10 per cent chance of retrieving a 5σ detection of a planet.
In the DPM for the F444W filter, there is a noticeable hard limit at 0.3 MJup. This cutoff arises from gaps in the isochrone grid, which does not extend to certain mass ranges at the adopted system age. As a result, detection probabilities are underestimated at the low-mass end, leading to the appearance of an artificial sharp boundary in the map.
In addition to the DPMs, complementary constraints based on the disk morphology can be overplotted, as shown in orange in Figure 9. The vertical dashed lines indicate the inner and outer edges of the debris disk, as well as the inner and outer boundaries of the central gap. The shaded orange region marks the dynamically unstable zone, where planets located within three Hill radii (RHill) would likely disrupt the surrounding disk material (see, e.g., Pearce & Wyatt 2014; Pearce et al. 2022; Pearce et al. 2024).
Additionally, the gray hatched region correspond to areas of the parameter space already ruled out by archival ground-based direct imaging detection limits from SPHERE/IRDIS in the H2 band (Mesa et al. 2021), converted into DPM following the same procedure described for JWST data. The dotted gray area delineates planet parameters excluded by Gaia’s Renormalised Unit Weight Error (RUWE): where RUWE<1.4, we follow the methodology from Limbach et al. (2024) to exclude companions with orbital periods shorter than Gaia DR3’s 1038-day baseline, and that of Kiefer et al. (2025) for longer-period orbits. Lastly, the blue curve represents the locus of planet parameters capable of reproducing the observed proper motion anomaly (PMa) in HD 92945. This curve is derived using the formalism of Kervella et al. (2019), based on the PMa catalog of Kervella et al. (2022), assuming a single planet in a circular orbit responsible for the astrometric signal as in Marino et al. (2020).
The new detection limits provided by JWST/NIRCam give access to a portion of parameter space that was previously unexplored. Thanks to these observations, we can exclude the presence of Jupiter-mass planets starting from 20-40 au and down to 0.4-0.5 MJup beyond 100 au with probabilities of 50% and 90%, respectively. More specifically, we can exclude the presence of planets that could shape the inner edge of the disk that are more massive than 0.5-0.8 MJup around 50 au, with probabilities of 50% and 90%, respectively. The same applies for the gap location at 80 au, where no planet is observed more massive than 0.4-0.6 MJup at the 50% and 90% confidence level, respectively. On the other hand, comparison between the DPM and the PMa curve suggests that a planet capable of producing the observed proper motion anomaly is expected to lie between 2.5 and 20 au, with a mass in the range of 0.4 -4.5 MJup. Larger semimajor axes are ruled out, as planets in those regions with sufficient mass to account for the PMa would have been detected by our observations. We also note that the detection limits derived for putative planets are highly model-dependent, particularly at this wavelength. For example, it is possible that a more massive planet, for instance one with a cloudy atmosphere, could still remain faint enough to fall below our current detection thresholds.
Using the gap width and location derived in this work (see Table 2), we can also estimate that a planet with a mass between 0.3 and 0.7 MJup, located at the gap center, could account for the depletion of solids through dynamical clearing. These masses are derived assuming a massless disk and the depletion zone of particles within 3 Hill radii on each side of the planet to be equal to the width of the gap (Gladman 1993; Ida et al. 2000; Kirsh et al. 2009; Friebe et al. 2022). These values can be compared to the sensitivity reached by JWST/NIRCam in the F444W filter (Figure 9) to see if we can further constrain, or even rule out, this scenario. At ~80 au, the white and grey contours in the DPM allow the detection of planets of 0.65 and 0.45 MJup, with a probability of 90 and 50 per cent, respectively. Thus, ruling out this gap-carving scenario, would require deeper observations to probe lower planetary masses. However, as mentioned previously, this scenario is not the only one suitable to explain the disk’s features. In particular, multiple planets could explain at the same time the observed gap and luminosity asymmetry when invoking secular apsidal resonances. However, a detailed characterization of possible planetary architectures is beyond the scope of this paper and will be presented in Bendahan-West et al. (submitted).
Overall, these results demonstrate that while jWST/NIRCam provide high sensitivity at wide separations, the parameter space for low-mass planets within or near the disk remains only partially explored. Future dynamical modeling, deeper multiwavelength imaging, and precision astrometry will be crucial to fully uncover the planetary architecture of HD 92945.
Parameters for the detected sources.
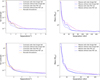 |
Fig. 8 Contrast curves (left panels) and mass detection limits (right panel) for F444W (top) and F200W (bottom) filters, as a function of projected separation. The yellow curve represents the contrast simulated by PanCAKE. The solid and dashed lines are obtained using one reference and the PSF library, respectively. Finally, the pink curves are retrieved from data where the disk was present and blue curves from disk-subtracted images. |
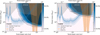 |
Fig. 9 Detection probability maps for F444W (left) and F200W (right) filters. JWST results are shown in shades of blue with the white, gray, and black contours representing the 90, 50, and 10% detection probabilities, respectively. The orange dashed vertical lines sign the mean inner and outer edges of the disk, along with the extension of the gap and, shaded in orange, the regions not allowed for planets. The hatched gray area represents planetary parameters excluded by archival SPHERE observations. The gray dotted region illustrates the planet parameter space excluded by Gaia RUWE. The blue curve was obtained modeling the Gaia DR3 proper motion anomaly as generated by a single planet orbiting HD 92945. |
5 Conclusions
We presented the first JWST/NIRCam observations of the debris disk surrounding HD 92945. The disk was successfully imaged at both 2 μm and 4.4 μm, revealing a broad, inclined structure with a prominent gap centered at −80 au, consistent with previous findings from ALMA and HST. Forward modeling using PSF libraries and MCMC sampling allowed us to constrain the disk’s geometry and dust distribution with fine details. At 2 μm, we recover inner and outer edges at −59 au and −98 au, and a gap with a width of −27 au and a fractional depth of −0.79. The disk appears to have a scale height nearly twice that inferred from submillimeter observations, indicating a vertical puffiness likely driven by radiation pressure on small grains. The inner slope of the dust density profile is shallower than that observed at longer wavelengths, while the outer slope is steeper, possibly reflecting differences in the grain size distribution and the influence of dynamical interactions. At both wavelengths, the disk shows a brightness asymmetry in the southwest portion of the inner ring. This feature is consistent with previous ALMA findings and may be explained by the presence of inner planetary companions perturbing the disk structure (Marino et al. 2019). Despite this, no comoving sources were identified in the field of view, and field sources were consistent with background galaxies or stars.
Contrast curves obtained after disk subtraction demonstrate a significant improvement in detection limits, enabling the exclusion of planets down to −0.7 and 5.7 MJup at 25 au at 4.4 and 2 μm, respectively. Detection probability maps indicate that Jupiter-mass planets can be excluded with high confidence beyond 20-40 au, and that the presence of a single massive planet beyond 20 au causing the proper motion anomaly is unlikely.
When combining the observed disk features with potential planetary scenarios, a single planet carving the gap at 80 au cannot be entirely ruled out. However, detection limits obtained with NIRCam constrain the upper mass of any such planet to −0.65 MJup. Alternatively, the detection of the azimuthal asymmetry at both 4 and 2 microns may point toward a more complex scenario involving two planets located interior to the disk, as already suggested by Marino et al. (2019). In this case, the planets would be responsible not only for carving the gap but also for inducing the observed asymmetry through secular apsidal resonances. This latter mechanism appears to provide a more comprehensive explanation for the full set of observational constraints. However, explaining the true origin of the gap is very degenerate and other scenarios could also explain the full set of observational constraints (see Bendahan-West et al. (in prep.) for a more comprehensive analysis).
This work highlights the power of JWST in combining high-contrast imaging with precise disk modeling, pushing the boundaries of planet detection and disk characterization at near infrared wavelengths. Future multiepoch observations and dynamical modeling will help clarify the nature of the inner disk asymmetry and further constrain the architecture of the HD 92945 planetary system.
Acknowledgements
Cecilia Lazzoni acknowledges the financial contribution from PRIN MUR 2022 (code 2022YP5ACE) funded by the European Union - NextGenerationEU. RBW is supported by a Royal Society grant (RF-ERE-221025). We acknowledge a humble dog named Winnie, whose companionship contributed significantly to the creation of the software called Winnie, which is utilized herein. We also acknowledge support from ANID - Millennium Science Initiative Program - Center Code NCN2024_001. We gratefully acknowledge support from the “Programma di Ricerca Fondamentale INAF 2023” of the National Institute of Astrophysics (Large Grant 2023 NextSTEPS). This work is based on observations with the NASA/ESA/CSA JWST, obtained at the Space Telescope Science Institute, which is operated by AURA, Inc., under NASA contract NAS 5-03127. These observations are associated with the JWST program 3989 (PI: S. Hinkley). The JWST data presented in this article were obtained from the Mikulski Archive for Space Telescopes (MAST) at the Space Telescope Science Institute. Support for program 3989 was provided by NASA through a grant from the Space Telescope Science Institute, which is operated by the Association of Universities for Research in Astronomy, Inc., under NASA contract NAS 5-03127.
References
- Adams, J., & Wang, J. 2020, RNAAS, 4, 227 [Google Scholar]
- Augereau, J. C., Lagrange, A. M., Mouillet, D., Papaloizou, J. C. B., & Grorod, P. A. 1999, A&A, 348, 557 [NASA ADS] [Google Scholar]
- Beuzit, J. L., Vigan, A., Mouillet, D., et al. 2019, A&A, 631, A155 [NASA ADS] [CrossRef] [EDP Sciences] [Google Scholar]
- Bonavita, M. 2020, Exo-DMC: Exoplanet Detection Map Calculator, Astrophysics Source Code Library [record ascl:2010.008] [Google Scholar]
- Carter, A. L., Skemer, A. J. I., Danielski, C., et al. 2021, SPIE Conf. Ser., 11823, 118230H [Google Scholar]
- Carter, A. L., Hinkley, S., Kammerer, J., et al. 2023, ApJ, 951, L20 [NASA ADS] [CrossRef] [Google Scholar]
- Chen, C. H., Patten, B. M., Werner, M. W., et al. 2005, ApJ, 634, 1372 [Google Scholar]
- Crotts, K. A., Carter, A. L., Lawson, K., et al. 2025, ApJ, 987, L41 [Google Scholar]
- Dahlqvist, C. H., Milli, J., Absil, O., et al. 2022, A&A, 666, A33 [NASA ADS] [CrossRef] [EDP Sciences] [Google Scholar]
- Foreman-Mackey, D., Hogg, D. W., Lang, D., & Goodman, J. 2013, PASP, 125, 306 [Google Scholar]
- Friebe, M. F., Pearce, T. D., & Löhne, T. 2022, MNRAS, 512, 4441 [Google Scholar]
- Gaia Collaboration (Brown, A. G. A., et al.) 2021, A&A, 649, A1 [NASA ADS] [CrossRef] [EDP Sciences] [Google Scholar]
- Gáspár, A., Wolff, S. G., Rieke, G. H., et al. 2023, Nat. Astron., 7, 790 [CrossRef] [Google Scholar]
- Gladman, B. 1993, ICARUS, 106, 247 [Google Scholar]
- Golimowski, D. A., Krist, J. E., Stapelfeldt, K. R., et al. 2011, AJ, 142, 30 [NASA ADS] [CrossRef] [Google Scholar]
- Gomez Gonzalez, C. A., Wertz, O., Absil, O., et al. 2017, AJ, 154, 7 [Google Scholar]
- Hinkley, S., Carter, A. L., Ray, S., et al. 2022, PASP, 134, 095003 [CrossRef] [Google Scholar]
- Ida, S., Bryden, G., Lin, D. N. C., & Tanaka, H. 2000, ApJ, 534, 428 [NASA ADS] [CrossRef] [Google Scholar]
- Kammerer, J., Girard, J., Carter, A. L., et al. 2022, SPIE Conf. Ser., 12180, 121803N [Google Scholar]
- Kervella, P., Arenou, F., Mignard, F., & Thévenin, F. 2019, A&A, 623, A72 [NASA ADS] [CrossRef] [EDP Sciences] [Google Scholar]
- Kervella, P., Arenou, F., & Thévenin, F. 2022, A&A, 657, A7 [NASA ADS] [CrossRef] [EDP Sciences] [Google Scholar]
- Kiefer, F., Lagrange, A.-M., Rubini, P., & Philipot, F. 2025, A&A, 702, A77 [NASA ADS] [CrossRef] [EDP Sciences] [Google Scholar]
- Kirchschlager, F., & Wolf, S. 2013, A&A, 552, A54 [NASA ADS] [CrossRef] [EDP Sciences] [Google Scholar]
- Kirsh, D. R., Duncan, M., Brasser, R., & Levison, H. F. 2009, Icarus, 199, 197 [NASA ADS] [CrossRef] [Google Scholar]
- Krivov, A. V., & Booth, M. 2018, MNRAS, 479, 3300 [NASA ADS] [CrossRef] [Google Scholar]
- Lafrenière, D., Marois, C., Doyon, R., & Barman, T. 2009, ApJ, 694, L148 [CrossRef] [Google Scholar]
- Lagrange, A.-M., Wilkinson, C., Mâlin, M., et al. 2025, Nature, 642, 905 [Google Scholar]
- Lawson, K., Currie, T., Wisniewski, J. P., et al. 2022, ApJ, 935, L25 [NASA ADS] [CrossRef] [Google Scholar]
- Lawson, K., Schlieder, J. E., Leisenring, J. M., et al. 2023, AJ, 166, 150 [NASA ADS] [CrossRef] [Google Scholar]
- Lawson, K., Schlieder, J. E., Leisenring, J. M., et al. 2024, ApJ, 967, L8 [Google Scholar]
- Limbach, M. A., Vanderburg, A., Venner, A., et al. 2024, ApJ, 973, L11 [Google Scholar]
- Linder, E. F., Mordasini, C., Mollière, P., et al. 2019, A&A, 623, A85 [NASA ADS] [CrossRef] [EDP Sciences] [Google Scholar]
- Marino, S. 2021, MNRAS, 503, 5100 [NASA ADS] [CrossRef] [Google Scholar]
- Marino, S., Carpenter, J., Wyatt, M. C., et al. 2018, MNRAS, 479, 5423 [NASA ADS] [CrossRef] [Google Scholar]
- Marino, S., Yelverton, B., Booth, M., et al. 2019, MNRAS, 484, 1257 [NASA ADS] [CrossRef] [Google Scholar]
- Marino, S., Zurlo, A., Faramaz, V., et al. 2020, MNRAS, 498, 1319 [Google Scholar]
- Marois, C., Lafrenière, D., Doyon, R., Macintosh, B., & Nadeau, D. 2006, ApJ, 641, 556 [Google Scholar]
- Matrà, L., Marino, S., Wilner, D. J., et al. 2025, A&A, 693, A151 [NASA ADS] [CrossRef] [EDP Sciences] [Google Scholar]
- Matthews, E. C., Carter, A. L., Pathak, P., et al. 2024, Nature, 633, 789 [NASA ADS] [CrossRef] [Google Scholar]
- Mawet, D., Milli, J., Wahhaj, Z., et al. 2014, ApJ, 792, 97 [Google Scholar]
- Mesa, D., Marino, S., Bonavita, M., et al. 2021, MNRAS, 503, 1276 [NASA ADS] [CrossRef] [Google Scholar]
- Meshkat, T., Bailey, V. P., Su, K. Y. L., et al. 2015, ApJ, 800, 5 [NASA ADS] [CrossRef] [Google Scholar]
- Meshkat, T., Mawet, D., Bryan, M. L., et al. 2017, AJ, 154, 245 [Google Scholar]
- Mustill, A. J., & Wyatt, M. C. 2009, MNRAS, 399, 1403 [NASA ADS] [CrossRef] [Google Scholar]
- Nielsen, E. L., De Rosa, R. J., Macintosh, B., et al. 2019, AJ, 158, 13 [Google Scholar]
- Nielsen, E. L., De Rosa, R., Macintosh, B., et al. 2020, in American Astronomical Society Meeting Abstracts, 235, American Astronomical Society Meeting Abstracts #235, 280.02 [Google Scholar]
- Pearce, T. D., & Wyatt, M. C. 2014, MNRAS, 443, 2541 [NASA ADS] [CrossRef] [Google Scholar]
- Pearce, T. D., Launhardt, R., Ostermann, R., et al. 2022, A&A, 659, A135 [NASA ADS] [CrossRef] [EDP Sciences] [Google Scholar]
- Phillips, M. W., Tremblin, P., Baraffe, I., et al. 2020, A&A, 637, A38 [NASA ADS] [CrossRef] [EDP Sciences] [Google Scholar]
- Pearce, T. D., Krivov, A. V., Sefilian, A. A., et al. 2024, MNRAS, 527, 3876 [Google Scholar]
- Plavchan, P., Werner, M. W., Chen, C. H., et al. 2009, ApJ, 698, 1068 [Google Scholar]
- Rebollido, I., Stark, C. C., Kammerer, J., et al. 2024, AJ, 167, 69 [NASA ADS] [CrossRef] [Google Scholar]
- Schneider, G., Grady, C. A., Hines, D. C., et al. 2014, ApJ, 148, 59 [Google Scholar]
- Sefilian, A. A., Rafikov, R. R., & Wyatt, M. C. 2023, ApJ, 954, 100 [Google Scholar]
- Silverstone, M. D. 2000, PhD thesis, University of California, Los Angeles [Google Scholar]
- Song, I., Zuckerman, B., & Bessell, M. S. 2004, ApJ, 614, L125 [Google Scholar]
- Soummer, R., Pueyo, L., & Larkin, J. 2012, ApJ, 755, L28 [Google Scholar]
- Squicciarini, V., & Bonavita, M. 2022, A&A, 666, A15 [NASA ADS] [CrossRef] [EDP Sciences] [Google Scholar]
- Tabeshian, M., & Wiegert, P. A. 2016, ApJ, 818, 159 [Google Scholar]
- Tamura, M. 2014, in IAU Symposium, 299, Exploring the Formation and Evolution of Planetary Systems, eds. M. Booth, B. C. Matthews, & J. R. Graham, 12 [Google Scholar]
- Thébault, P. 2009, A&A, 505, 1269 [Google Scholar]
- Vigan, A., Fontanive, C., Meyer, M., et al. 2021, A&A, 651, A72 [EDP Sciences] [Google Scholar]
- Yelverton, B., & Kennedy, G. M. 2018, MNRAS, 479, 2673 [NASA ADS] [CrossRef] [Google Scholar]
Appendix A Corner plots
In Figure A.1 we show the corner plot for the fourteen free parameters of the MCMC simulation. Specifically, we show the results obtained for the disk as seen at 2 μm when using the entire PSF library and a butter fly-shaped mask to cover the bright portion arising close to the minor axis of the disk.
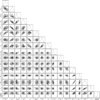 |
Fig. A.1 Corner plot of the fourteen free parameters varied in the MCMC simulation run for the F200W disk’s images of HD 92945 where the bright area close to the minor axis is masked. |
Appendix B Candidates PSFs fitting
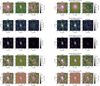 |
Fig. B.1 Characterization, from top to bottom, of the sources C2, C3, C4, C5, and C6 in the F444W field of view. On the left side, modeling coming from forward modeling of a point-like PSF. On the right, convolution of the synthetic PSF, with a 2D Gaussian. |
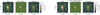 |
Fig. B.2 Characterization of the sources C3 in the F200W field of view. On the left side, modeling coming from forward modeling of a point-like PSF. On the right, convolution of the synthetic PSF, with a 2D Gaussian. |
All Tables
All Figures
|
Fig. 1 NIRCam reductions for HD 92945 for the F444W (left panel) and the F200W (right panel) filters. Both images where obtained performing RDI with HD 92921 as reference. The images are rotated to northeast, with the scale bar in the bottom left corner representing a projected distance of 50 au. |
| In the text | |
|
Fig. 2 F200W data, model, and residuals of HD 92945’s disk using one reference, HD 92921, (top panels) and the PSF library considering the entire image (second row) or excluding the bright regions close to the minor axis (last row). |
| In the text | |
|
Fig. 3 Smoothed images of the residuals obtained after modeling and subtracting the disk in the F444W (left panel) and F200W (right panel) filters. The disk luminosity asymmetry detected in both filters in the west portion of the disk is pointed by the arrow. For the both filters, we also added the 2 × 10⁻⁴ Jy/beam contour level from ALMA data (Marino et al. 2019). |
| In the text | |
|
Fig. 4 From left to right, F444W data, model, and residuals of HD 92945’s disk using: (a) the same morphological parameters adopted for the disk as seen at 2 μm and one reference, HD 92921, (first row) or the PSF library (second row); (b) the same morphological parameters adopted at 2 μm with the exception of lout, optimized for these data, using the same single reference, (mid-bottom panels) or the PSF library (bottom panels). |
| In the text | |
|
Fig. 5 Radial density distribution of the dust obtained from PSF libray+mask modeling of F200W and F444W JWST data (dark blue and light blue curves) and comparison with ALMA (pink curves) and HST (green curve). For F200W JWST filter and ALMA, the solid line represents the median, while the shaded areas represent the 68, 95, and 99.7 per cent confidence regions as obtained by Marino (2021). F444W JWST profile was obtained using the mean parameters derived at 2 μm (column four of Table 2), with the exception of lout, set at 30. For HST, the curve is taken from Fig. 7 of Golimowski et al. (2011). |
| In the text | |
|
Fig. 6 Deprojected radial profile at 2 μm before (green curves) and after (red curves) disk model subtraction. The grey area represents the 1 arcsec region excluded from the modeling. |
| In the text | |
|
Fig. 7 Candidates in the field of view of NIRCam F444W (left panel) and F200W (right panel) as seen after the subtraction of the disk via the modeling. Candidates are encircled in white and named Cx with x=1,2,3,4,5,6. The scale bar in the bottom left corner represents a projected distance of 50 au. |
| In the text | |
|
Fig. 8 Contrast curves (left panels) and mass detection limits (right panel) for F444W (top) and F200W (bottom) filters, as a function of projected separation. The yellow curve represents the contrast simulated by PanCAKE. The solid and dashed lines are obtained using one reference and the PSF library, respectively. Finally, the pink curves are retrieved from data where the disk was present and blue curves from disk-subtracted images. |
| In the text | |
|
Fig. 9 Detection probability maps for F444W (left) and F200W (right) filters. JWST results are shown in shades of blue with the white, gray, and black contours representing the 90, 50, and 10% detection probabilities, respectively. The orange dashed vertical lines sign the mean inner and outer edges of the disk, along with the extension of the gap and, shaded in orange, the regions not allowed for planets. The hatched gray area represents planetary parameters excluded by archival SPHERE observations. The gray dotted region illustrates the planet parameter space excluded by Gaia RUWE. The blue curve was obtained modeling the Gaia DR3 proper motion anomaly as generated by a single planet orbiting HD 92945. |
| In the text | |
|
Fig. A.1 Corner plot of the fourteen free parameters varied in the MCMC simulation run for the F200W disk’s images of HD 92945 where the bright area close to the minor axis is masked. |
| In the text | |
|
Fig. B.1 Characterization, from top to bottom, of the sources C2, C3, C4, C5, and C6 in the F444W field of view. On the left side, modeling coming from forward modeling of a point-like PSF. On the right, convolution of the synthetic PSF, with a 2D Gaussian. |
| In the text | |
|
Fig. B.2 Characterization of the sources C3 in the F200W field of view. On the left side, modeling coming from forward modeling of a point-like PSF. On the right, convolution of the synthetic PSF, with a 2D Gaussian. |
| In the text | |
Current usage metrics show cumulative count of Article Views (full-text article views including HTML views, PDF and ePub downloads, according to the available data) and Abstracts Views on Vision4Press platform.
Data correspond to usage on the plateform after 2015. The current usage metrics is available 48-96 hours after online publication and is updated daily on week days.
Initial download of the metrics may take a while.