Fig. 8
Download original image
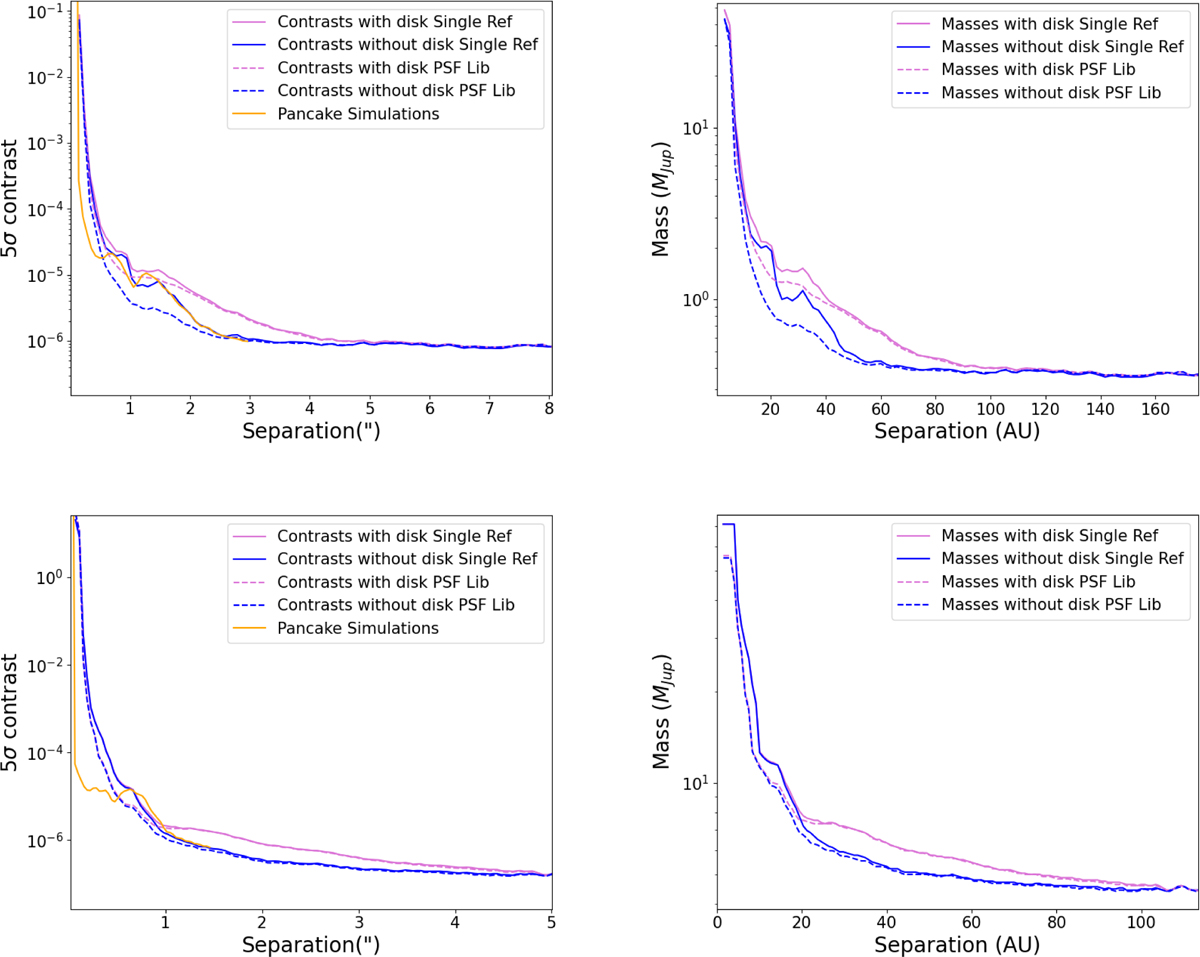
Contrast curves (left panels) and mass detection limits (right panel) for F444W (top) and F200W (bottom) filters, as a function of projected separation. The yellow curve represents the contrast simulated by PanCAKE. The solid and dashed lines are obtained using one reference and the PSF library, respectively. Finally, the pink curves are retrieved from data where the disk was present and blue curves from disk-subtracted images.
Current usage metrics show cumulative count of Article Views (full-text article views including HTML views, PDF and ePub downloads, according to the available data) and Abstracts Views on Vision4Press platform.
Data correspond to usage on the plateform after 2015. The current usage metrics is available 48-96 hours after online publication and is updated daily on week days.
Initial download of the metrics may take a while.