Fig. 9
Download original image
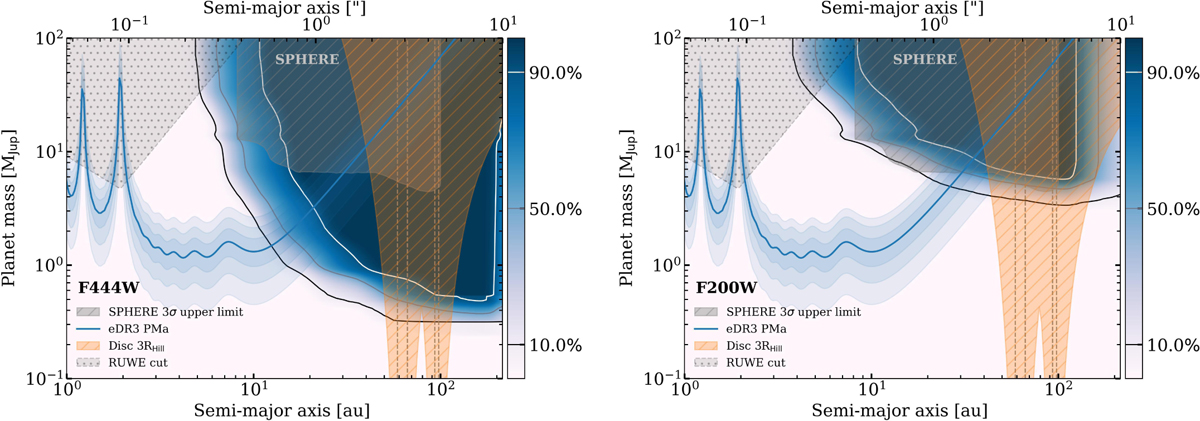
Detection probability maps for F444W (left) and F200W (right) filters. JWST results are shown in shades of blue with the white, gray, and black contours representing the 90, 50, and 10% detection probabilities, respectively. The orange dashed vertical lines sign the mean inner and outer edges of the disk, along with the extension of the gap and, shaded in orange, the regions not allowed for planets. The hatched gray area represents planetary parameters excluded by archival SPHERE observations. The gray dotted region illustrates the planet parameter space excluded by Gaia RUWE. The blue curve was obtained modeling the Gaia DR3 proper motion anomaly as generated by a single planet orbiting HD 92945.
Current usage metrics show cumulative count of Article Views (full-text article views including HTML views, PDF and ePub downloads, according to the available data) and Abstracts Views on Vision4Press platform.
Data correspond to usage on the plateform after 2015. The current usage metrics is available 48-96 hours after online publication and is updated daily on week days.
Initial download of the metrics may take a while.