Open Access
Fig. B1
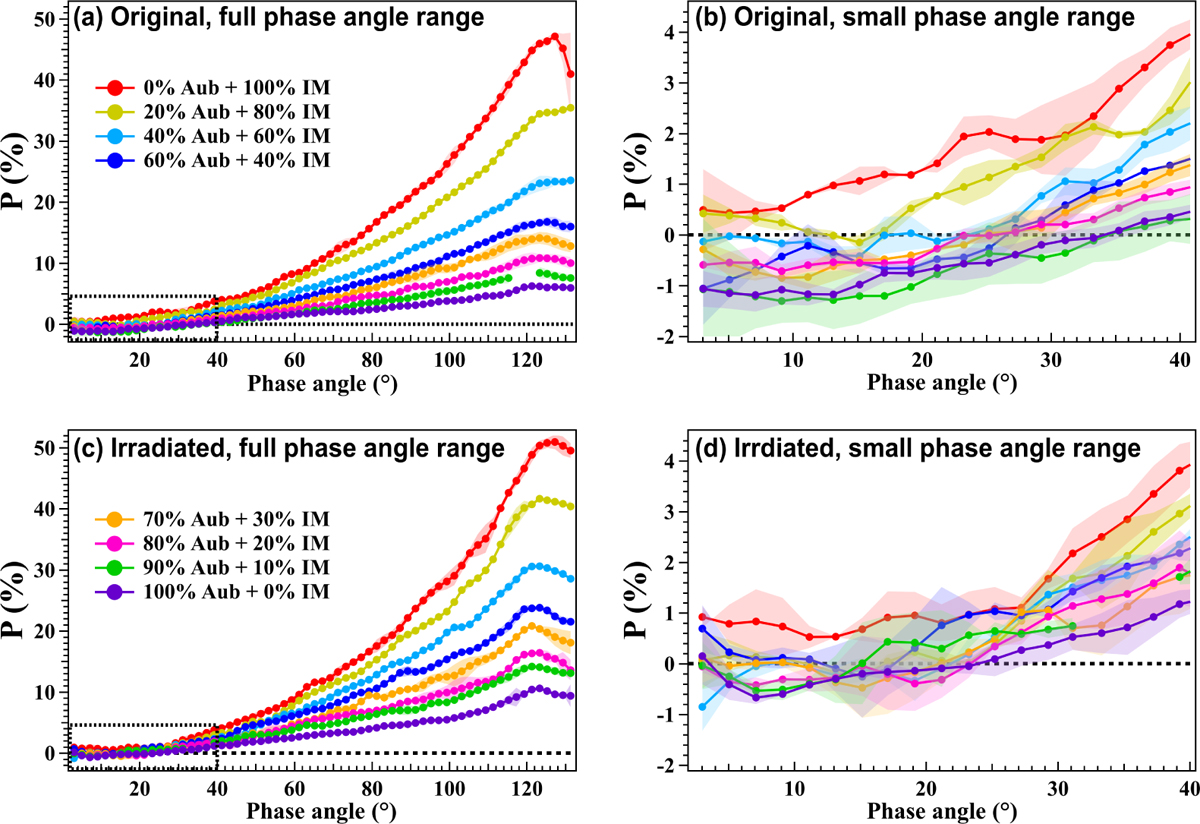
Download original image
Smoothed data of the polarization curves of all mixture samples. The colored shadows around the lines represent the deviations from the mean of two measurement runs over two independent surface realizations. (b) and (d) are enlargements of the small phase angle regions outlined in (a) and (c), respectively.
Current usage metrics show cumulative count of Article Views (full-text article views including HTML views, PDF and ePub downloads, according to the available data) and Abstracts Views on Vision4Press platform.
Data correspond to usage on the plateform after 2015. The current usage metrics is available 48-96 hours after online publication and is updated daily on week days.
Initial download of the metrics may take a while.