| Issue |
A&A
Volume 704, December 2025
|
|
|---|---|---|
| Article Number | A20 | |
| Number of page(s) | 15 | |
| Section | Planets, planetary systems, and small bodies | |
| DOI | https://doi.org/10.1051/0004-6361/202555612 | |
| Published online | 26 November 2025 | |
Reflectance-spectroscopic and polarization measurements of meteorite mixtures relevant to E- and M-type asteroids
1
School of Earth Sciences and Hubei Key Laboratory of Planetary Geology and Space Explorations, China University of Geosciences,
Wuhan,
China
2
Institute of Geochemistry, Chinese Academy of Sciences,
Guiyang,
China
3
Department of Astronomy and Space Informatics, V. N. Karazin Kharkiv National University,
Kharkiv,
Ukraine
4
State Key Laboratory of Lunar and Planetary Science, Macau University of Science and Technology,
Macau
5
Department of Physics, University of Central Florida,
Orlando,
FL,
USA
6
Purple Mount Observatory, Chinese Academy of Sciences,
Nanjing,
China
★ Corresponding authors: This email address is being protected from spambots. You need JavaScript enabled to view it.
; This email address is being protected from spambots. You need JavaScript enabled to view it.
; This email address is being protected from spambots. You need JavaScript enabled to view it.
Received:
21
May
2025
Accepted:
18
September
2025
Abstract
Context. Metal-rich asteroids are of significant interest due to their spectral diversity and their potential to shed light on early planetary differentiation and core formation processes. E- and M-type asteroids are generally thought to consist of iron-poor silicates (e.g., enstatite) and metallic components, yet their precise composition and surface morphology remain poorly constrained. The effects of space weathering on these bodies are also not well understood.
Aims. This study aims to experimentally examine how variations in metal content and simulated micrometeorite bombardment influence the spectral, photometric, and polarimetric properties of silicate-metal mixtures.
Methods. Mixtures of enstatite-rich aubrite and iron meteorite powders were prepared in varying proportions. Pulsed laser irradiation was used to simulate micrometeorite impacts. Scanning electron microscopy (SEM), reflectance spectroscopy, bi-directional reflectance, and linear polarimetry were employed to characterize the samples before and after irradiation.
Results. Increasing metal content enhanced the near-infrared spectral slope and suppressed the 3 μm absorption band while having minimal impact on mid-infrared silicate features. Reflectance increased in the principal plane but decreased outside of it. Polarimetric measurements showed that both the minimum and maximum degrees of polarization (Pmin and Pmax) were strongly dependent on metal content. Laser irradiation further increased the visible-to-near-infrared spectral slope and altered the scattering behavior, enhancing backscattering and reducing forward scattering, particularly in metal-rich samples. Additionally, irradiation reduced polarization at small phase angles, producing a “squeezing effect” on the polarization curves and confining the results to the E-type asteroid domain in Pmin–αinv space.
Key words: radiative transfer / techniques: photometric / techniques: polarimetric / techniques: spectroscopic / meteorites, meteors, meteoroids / minor planets, asteroids: general
© The Authors 2025
 Open Access article, published by EDP Sciences, under the terms of the Creative Commons Attribution License (https://creativecommons.org/licenses/by/4.0), which permits unrestricted use, distribution, and reproduction in any medium, provided the original work is properly cited.
This article is published in open access under the Subscribe to Open model. This email address is being protected from spambots. You need JavaScript enabled to view it. to support open access publication.
1 Introduction
The featureless reflectance spectra of X-complex asteroids have made their mineralogical interpretations challenging (Tholen 1984; Clark et al. 2004b; Fornasier et al. 2011). Spectroscopically, X-complex asteroids typically exhibit reddish spectral slopes in the visible and near-infrared (VNIR) region but lack distinct absorption features. Their wide range of albedos, however, suggests they encompass bodies with highly diverse mineralogies. While X-complex asteroids are distributed throughout the main belt, they show a notable concentration around 3.0 AU, between the regions dominated by C-complex and S-complex asteroids. This broad spatial distribution suggests that X-complex asteroids may represent a transitional group, both in composition and orbital evolution (Mothé-Diniz et al. 2003).
Tholen (1984) classified these asteroids into three subtypes based on their visual albedos: E-type, M-type, and P-type. E-type asteroids, characterized by high visual albedos (>0.3), have traditionally been considered the parent bodies of the aubrites (Zellner et al. 1977; Clark et al. 2004a; Fornasier et al. 2008). Among meteorites, aubrites are distinctive for their high reflectance and the absence of prominent 1 μm and 2 μm absorption bands (Watters & Prinz 1979). However, later studies have shown that some E-type asteroids are not entirely featureless in the VNIR range, exhibiting weak absorption bands near 0.5 μm, 0.9 μm, 1.8 μm, or 3 μm. The origin of these bands remains unclear, but it has been tentatively attributed to carbonaceous chondritic inclusions (Cloutis & Gaffey 1993). M-type asteroids have historically been linked with iron meteorites due to their similarly flat spectra in the VNIR range and moderate visual albedos. However, enstatite chondrites have also been proposed as potential analogs for M-type asteroids (Gaffey 1976; Fornasier et al. 2010). Additionally, some faint absorption bands near 0.9 and 1.9 μm have been identified on the surfaces of some M types (Hardersen et al. 2005; Ockert-Bell et al. 2010; Fornasier et al. 2010), suggesting that these bodies may consist of a mixture of silicates and metallic iron. Cantillo et al. (2021) suggested that the best-matching mixture to (16) Psyche consists of 82.5% metal, 7% low-Fe pyroxene, and 10.5% carbonaceous chondrite by weight. P-type asteroids are low-albedo (<0.1) objects with no definitive meteorite analogs. They are hypothesized to resemble carbonaceous chondrites but with a higher organic content, which may explain their strong red spectral slopes (Gaffey & Wu 1989; Vilas et al. 1994).
Many remote sensing observations (e.g., disk-resolved) and laboratory measurements of reflectance spectra are conducted as bidirectional reflectance. The ability of a surface to reflect light in different directions is quantified by the bidirectional reflectance distribution function (BRDF) (Hapke 2012). The BRDF characteristics of airless body surfaces offer valuable insights into the physical properties of the regolith, including particle size distribution, grain transparency, surface roughness, and porosity (Lumme & Bowell 1981; Muinonen et al. 2002; Shkuratov et al. 1999, 2025; Sun et al. 2014). Since metal-rich asteroids are thought to exhibit considerable material and structural heterogeneity on their surfaces (Castro-Chacón et al. 2022), an accurate understanding of the surface BRDF is crucial for the interpretation of remote-sensing reflectance data (Li et al. 2015). For example, Britt & Pieters (1988) measured the bidirectional reflectance spectra of iron–nickel meteorites and demonstrated that the optical properties of metal-rich surfaces are strongly influenced by surface texture, primarily through its effect on observational geometry. Building on this, Cloutis et al. (2010) showed that variations in surface texture differently affect the reflectance and spectral slope of iron meteorites in slab versus powder forms. These spectral distinctions can be used to constrain surface properties and to interpret the origin of rotational spectral variations observed in M-type asteroids.
In addition to reflectance spectroscopy, polarimetry has proven to be a valuable tool for studying asteroid surfaces (Belskaya et al. 2015; Bagnulo et al. 2024). The degree of linear polarization, P, of sunlight reflected by asteroids’ surfaces is defined as
![Mathematical equation: $\[P=\frac{I_{\perp}-I_{\|}}{I_{\perp}+I_{\|}},\]$](/articles/aa/full_html/2025/12/aa55612-25/aa55612-25-eq1.png) (1)
(1)
where I⊥ and I∥ are the reflected radiances polarized perpendicular and parallel to the scattering plane, and P as a function of the solar phase angle, α, is schematically shown in Fig. 1. Among the polarization-phase curve parameters shown in Fig. 1, Pmin, αinv, and Pmax have been found particularly interesting. For example, the region in parameter space spanned by [Pmin, αinv] has been found to contain information about an asteroid’s surface texture and composition (Dollfus et al. 1989; Belskaya et al. 2017). With the growing availability of polarimetric data in recent years, integrating polarization measurements with traditional asteroid taxonomy, primarily based on visible and near-infrared (VNIR) spectroscopy, has become increasingly feasible.
Dollfus et al. (1979) compared the polarization-phase curves of iron-nickel powders with observational data of M-type asteroids and concluded that these asteroids are large metallic fragments, likely parent bodies of iron meteorites, with surfaces covered by fine metallic particles produced by impact processes. Shkuratov et al. (1992), Shkuratov & Ovcharenko (1992), Shkuratov & Ovcharenko (2002), and Shkuratov et al. (2025) performed photometric polarimetric measurements and computer simulations on planetary surface analogs and found that the negative polarization branch on the powdered surface is related to the particle size and degree of compaction. Gil-Hutton (2007) conducted polarimetric observations of 26 M-type asteroids and found that Psyche exhibits a unique polarization-phase curve compared to other M-type asteroids. Additionally, significant differences in polarization-phase curves were observed between M-type asteroids with and without 3 μm absorption features. Hadamcik et al. (2011) performed polarimetric measurements on potential meteorite analogs for the surface of (21) Lutetia, the target of the Rosetta mission. Their results suggest that the average regolith particle size on this body is smaller than 50 μm. Castro-Chacón et al. (2022) measured the polarimetric light curve of Psyche at a phase angle of 17° and found a 0.14% variation in the degree of polarization, possibly caused by surface inhomogeneities. Belskaya et al. (2022) analyzed the polarization of 22 M/X-type asteroids, incorporating earlier observational data, and found that M-type asteroids exhibit a broader range of polarization parameters than other types. They also identified two distinct groups of M-type asteroids with different polarization characteristics, suggesting possible compositional differences. In recent years, the polarization features of M-type asteroids have been recognized as key indicators of their material composition (Belskaya et al. 2010, 2021, 2024). Although the polarization features of asteroids may not be as distinctive as spectroscopic features, they can be more easily measured using small-aperture telescopes (Pan & Ip 2022). Therefore, understanding the accurate relationship between the polarization characteristics of M-type asteroids and their material properties is crucial for the exploration of these objects.
Interest in studying metal-rich asteroids has increased since (16) Psyche, the largest M-type asteroid, was selected as the target of NASA’s Psyche mission. However, remote observations of (16) Psyche have not resolved contradictions in our understanding of its composition (Elkins-Tanton et al. 2020), limiting our understanding of metal-rich asteroids. Therefore, gaining a deeper insight into their composition is crucial. E- and M-type asteroids are generally believed to contain iron-poor silicate (enstatite) and metallic components, but their exact composition and morphology remain unclear. Undoubtedly, the ratio of silicates to metals in these bodies significantly influences their optical properties including reflectance spectra and photometric and polarimetric phase curves. In addition, the effects of space weathering on metal-rich objects may differ significantly from those on silicate-rich bodies. To address these questions, we prepared mixtures of aubrite and iron meteorite in varying proportions and performed pulsed laser irradiations to simulate micrometeorite bombardment. We then carried out spectroscopic, bidirectional reflectance and polarimetric measurements on samples both before and after irradiations. Our study focused on the optical effects of metal content in the silicate-metal mixed system and on the modifications induced by pulsed laser irradiation.
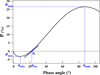 |
Fig. 1 Schematic diagram of key parameters in polarization-phase curve. |
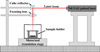 |
Fig. 2 Schematic of pulsed laser irradiation system. The entire system is mounted on an optical table. |
2 Samples and methods
2.1 Samples and processing
To simulate the possible compositions of E- and M- asteroid surface materials, we selected two meteorite specimens for our experiments: “Norton County,” a Ca-poor aubrite fragmental breccia, and “Aletai,” an iron meteorite fragment classified as IIIE-an. Photographs of the samples can be found in Appendix A. The primary mineral in aubrite is enstatite, while iron meteorites are primarily composed of iron-nickel alloys that are mainly kamacite and taenite. Both samples were first lightly polished to remove visibly weathered surfaces. Fresh portions of the meteorites were then ground into powders with particle sizes smaller than 45 μm and mixed in varying volume ratios. Table A.1 lists the mixing proportions of the samples with their pictures before and after irradiation.
2.2 Pulsed-laser irradiation
The schematics of the pulsed-laser irradiation system is shown in Fig. 2 (Yang et al. 2017; Jiang et al. 2019). The system consisted of a Continuum Minilite II nanosecond Nd:YAG pulsed laser, operating at a wavelength of 1064 nm and capable of delivering single pulses with energies ranging from 1 to 50 mJ. The laser beam was focused by a lens and directed vertically onto the sample, which was placed inside a vacuum chamber mounted on a motorized two-dimensional translation stage. Prior to irradiations, 0.75 mL of the sample was placed in a quartz sample holder inside the chamber. To prevent powder sputtering outside the chamber, the sample holder was covered with a thin glass slide. The chamber was pumped down to a vacuum level of 10−3 Pa. To ensure uniform irradiation across the entire sample surface, the translation stage was programmed to move at a constant speed of 1 mm/s along the x- and y-axes during irradiation. The pulse width of 6–7 nanoseconds is believed to be comparable to the timescale of real micrometeorite impacts (Yamada et al. 1999). A single pulse with an energy of 30 mJ was focused to a spot diameter of 0.5 mm, yielding an energy density of 150 mJ/mm2. Each sample was subjected to a total of six laser pulses.
2.3 Fourier transform infrared spectra measurement
Before and after laser irradiation, the reflectance spectra of the samples were measured using a Bruker Vertex 70 Fourier transform infrared spectrometer equipped with EasiDiff reflectance accessories (an aluminum system for the VNIR range and a gold system for the mid-infrared, respectively) from Pike Technologies. The scattering configuration was approximated to be biconical, with both incident and viewing zenith angles of 45°. The spectral resolution was 16 cm−1 in the range of 0.5–1.0 μm and 4 cm−1 in the range of 1.0–25 μm. To obtain the relative reflectance value of the sample, a Labsphere SpectralonTM standard with a nominal reflectance of 99% was used for the visible and near-infrared region (0.5–2.5 μm), while a Labsphere InfragoldTM standard was used for the mid-infrared (MIR) region (2.5–25 μm). Powdery samples were gently poured into the holder and leveled using a spatula to create a flat surface. To minimize potential spectral variations caused by surface inhomogeneities, four measurements were taken for each sample, with the sample holder rotated 90° after each measurement. The average of these four measurements was used as the typical spectrum for the sample. All measured spectra were smoothed using the binomial algorithm.
2.4 Bidirectional reflectance-spectrum measurement
Bidirectional reflectance spectra were measured using a motorized version of the instrument described by Jiang et al. (2022). Light from a quartz tungsten halogen lamp was coupled into a fiber optic cable and was collimated before incident onto the sample surface. The goniometer consisted of two motorized rotary stages with arms that carry the incident and viewing optical components. Both the incident and viewing zenith angles can be adjusted from 0° to 70° continuously. The reflected light was collected by a bare optic fiber and directed into a Spectral Evolution SR-2500 spectrometer. The spectrometer provided a spectral resolution of 3.5 nm within the 350–1000 nm range and 22 nm within the 1500–2100 nm range. BRDF measurements conducted with a Labsphere Spectralon plaque with a nominal reflectance of 99% showed good agreement with our previous measurements (Voss & Zhang 2006; Zhang et al. 2022a; Zheng et al. 2025). The sample holder used in this and the polarization measurement had a diameter of 20 mm and a depth of 2.2 mm, ensuring that the elliptical laser spot incident on the sample surface at 40° incidence (16 mm×7.5 mm) was fully included. We present the BRDF data in terms of the reflectance factor (REFF) as
![Mathematical equation: $\[R E F F_{\text {sample}}=\frac{I_{\text {sample}}}{I_{\text {Spectralon}}} \times R E F F_{\mathrm{RELAB}}^{\text {Spectralon}},\]$](/articles/aa/full_html/2025/12/aa55612-25/aa55612-25-eq2.png) (2)
(2)
where Isample, ISpectralon, and ![Mathematical equation: $\[R E F F_{\text {RELAB}}^{\text {Spectralon}}\]$](/articles/aa/full_html/2025/12/aa55612-25/aa55612-25-eq3.png) are the sample radiance, Spectralon radiance, and the Spectralon REFF measured by RELAB (Zheng et al. 2025).
are the sample radiance, Spectralon radiance, and the Spectralon REFF measured by RELAB (Zheng et al. 2025).
2.5 Polarization measurements
Polarization measurement was performed using a 3-color goniometer (Zhang et al. 2022a). A Melles-Griot 35 mW 633 nm helium–neon laser was used as the light source. After passing through a liquid crystal speckle reducer, the beam was focused into a multimode fiber and directed to the incident optics assembly mounted on a manually rotatable arm. After exiting the fiber, the laser light was collimated by a collimator before any incident onto the sample surface. The collection’s optics assembly, consisting of a linear polarizer, a focusing lens, and a silicone photodiode, was mounted on a rotatable arm controlled by a servo motor. The fore-optics of both the incident and viewing optics assemblies were positioned 1 m away from the sample surface, giving an angular resolution of approximately 1.5°. Additionally, a monitor detector is positioned to observe the sample surface for laser power fluctuations. To maximize phase angle coverage, the incident angle was set to 60° to allow a maximum phase angle of 130°. The sample holder was the same as that used in the bidirectional reflectance-spectrum measurement.
The degree of linear polarization was obtained by sequentially measuring I⊥ and I∥ appearing in Eq. (1). Specifically, the grains were poured into the sample holder, and the top layer was leveled with a ruler to prepare a sample realization. Upon this realization, we first measured two equivalent linear polarization ratios, P1 and P2, defined as
![Mathematical equation: $\[P_1=\frac{I_{0^{\circ}}-I_{90^{\circ}}}{I_{0^{\circ}}+I_{90^{\circ}}}\]$](/articles/aa/full_html/2025/12/aa55612-25/aa55612-25-eq4.png) (3a)
(3a)
![Mathematical equation: $\[P_2=\frac{I_{180^{\circ}}-I_{270^{\circ}}}{I_{180^{\circ}}+I_{270^{\circ}}},\]$](/articles/aa/full_html/2025/12/aa55612-25/aa55612-25-eq5.png) (3b)
(3b)
and took their average as the measurement result for this sample realization. In these notations, 0° and 180° indicate that the polarizer’s transmission axis was aligned perpendicular to the principal plane; i.e., both I0° and I180° correspond to I⊥. Conversely, 90° and 270° indicate alignment parallel to the principal plane; i.e., both I90° and I270° correspond to I∥.
After completing the first run as described above, the sample holder was emptied, and the same sample was reloaded for a second run in which another set of P1 and P2 was measured and averaged in the same manner. The final value of P was taken as the average of the two runs over two independent sample realizations, and the deviations from this mean (shown as shadows in Fig. B1) were used as approximate estimates of the measurement uncertainty.
We adopted the above measurement methodology for the following reasons. Although care was taken to align the polarizer axis perpendicular to the viewing direction, small residual misalignments were unavoidable due to mechanical imperfections. When the polarizer was rotated by 180°, the effect of this misalignment should be symmetrical between 0° and 180° (and likewise between 90° and 270°). Because it is not possible to determine a priori which pair provides the more accurate linear polarization ratio, using the average of P1 and P2 may provide a more accurate linear polarization ratio.
To reduce spiky features in the resulting polarization curves, which may be caused by residual laser power fluctuations and/or laser speckle effects, we applied the smoothing method described in Appendix B. As shown in Fig. B2, this smoothing effectively reduced anomalous data points without altering the overall trend of the original data.
2.6 Scanning electron microscope observation
To examine the possible compositional and microscopic structural modifications in aubrite-iron meteorite mixtures caused by pulsed laser irradiation, we conducted scanning electron microscope (SEM) measurements. We used a FEI Scios Dual Beam SEM to obtain secondary electron and backscattered electron images.
3 Results
3.1 SEM images
Figure 3 shows the SEM images of the meteorite mixture samples before and after irradiation. After mechanical fragmentation, enstatite particles typically exhibit regular columnar or platy shapes with sharp edges and fractures, whereas iron–nickel alloy particles generally lack regular shapes. Small fragments of particles adhere to the surface of fresh enstatite, and cracks formed during fragmentation are visible. On fresh iron–nickel alloy particles, strip-like textures with widths of approximately 0.5 μm can be observed.
After laser irradiation, both types of particles are covered with a layer of molten material, becoming smoother and more rounded. Nanoscale vesicles are visible within these layers. Mutual contamination between the two particle types is also evident: discrete molten metal spheres are observed on the surface of the enstatite particles, while numerous enstatite fragments are embedded in the molten layer on the metal particles. The subtle textures and cracks present on the grains before irradiation have disappeared and been replaced by molten material.
3.2 Reflectance spectra and BRDF
Figure 4 shows the reflectance spectra of aubrite and iron meteorite mixtures before and after irradiation. The pure aubrite sample exhibits a distinct red slope in the visible region, with its relative reflectance reaching approximately 0.5 at 0.7 μm. No apparent 1 μm or 2 μm silicate absorption bands, typically caused by crystal field splitting of ferrous iron (Fe2+), can be observed. However, a strong 3 μm absorption band, attributed to hydrated minerals, is present. With the increase of iron meteorite content, the VNIR reflectance spectra darken and flatten progressively. The steep slope in the 0.4–0.6 μm region, primarily due to aubrite, becomes increasingly obscured. The 3 μm absorption feature weakens significantly but remains detectable. In the MIR region, the Christiansen feature between 8 and 9 μm, associated with aubrite, nearly disappears when the iron meteorite content reaches 40%, whereas other absorption features remain largely unaffected.
As shown in Table A.1, irradiation caused visual darkening for all samples. All irradiated samples become darker and redder in the VNIR region (Fig. 4). Irradiation weakens enstatite’s steep slope within 0.35–0.6 μm, making the spectra in the VNIR region appear more “linear.” Irradiation weakens the 3 μm absorption band and causes the substructures at 2.8 and 2.9 μm to merge. The silicate spectral features in the MIR are barely affected by irradiation (Yang et al. 2017).
The BRDF data of the samples are presented in Appendix C. Figs. C1 and C2 show the REFF in contour plots at 633 nm for the samples before and after irradiation, respectively, whereas Fig. C3 shows the phase angle dependence of the REFF at 633 nm for all samples. Obviously, the overall scattering behavior of the mixture is dominated by contributions from aubrite and the reflectance value of the mixture decreases as the iron meteorite content increases. All samples show strong enhanced backscattering near the 0° phase angle (opposition effect), as well as a forward-scattering lobe at large phase angles. As the iron meteorite content increases, scattering near the principal plane becomes more prominent, while scattering out of the principal plane, particularly in the direction perpendicular to it, diminishes (Fig. C1). Moreover, the forward-scattering lobe is progressively suppressed and almost disappears for a pure iron meteorite (Fig. C3h). The most significant effect of irradiation is darkening, and this darkening of BRDF is not uniform over the phase angle. For samples dominated by aubrite, the darkening caused by irradiation is quite uniform at all phase angles. However, as the iron meteorite content increased, the reflectance at small phase angles underwent less and less change, and that at large phase angles is darkened more, causing the suppression of the forward-scattering lobe.
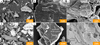 |
Fig. 3 SEM images of meteorite mixture samples before and after laser irradiation. (a) Backscattered electron image of the original aubrite-iron meteorite mixture. (b) Secondary electron image of an original aubrite particle. (c) Secondary electron image of an original iron-meteorite particle. (d) Backscattered electron image of the irradiated aubrite-iron meteorite mixture. (e) Secondary electron image of an irradiated aubrite particle. (f) Backscattered electron image of an irradiated iron-meteorite particle. |
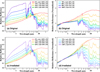 |
Fig. 4 Spectral reflectance from 0.35 to 25 μm of original (a) and irradiated (c) meteorite mixture samples. The spectra, normalized at 0.55 μm, are presented in (b) and (d). Samples of different compositions are represented by different colors. Solid lines correspond to fresh samples, while the dashed lines in (c) and (d) represent irradiated samples. In the legend, Aub denotes aubrite, and IM denotes iron meteorite. The same notations are used in all subsequent figures. |
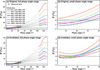 |
Fig. 5 Polarization curves of meteorite mixture samples before and after irradiation, measured at a 60° incident zenith. Panels (b) and (d) are magnified areas outlined by the dotted boxes in (a) and (c), respectively. Gray triangles are measurement data and colored lines are fit curves. |
3.3 Linear polarization
Figure 5 shows the dependence of the degree of linear polarization on the phase angle. Since the measurement data are bumpy, we performed curve fittings at small and large phase angle regions to better display the polarization features. Among the original samples, the pure iron meteorite shows no negative polarization, and the 80% IM+20% Aub mixture shows quite weak negative polarization. After irradiation, all samples except the pure iron meteorite exhibit negative polarization.
The fresh pure aubrite has |Pmin| and αinv values of 1% and 35°. As the iron meteorite content increases, the negative polarization gradually weakens and disappears entirely when the iron content reaches 80%. When iron content reaches 60%, the negative polarization is still present, with |Pmin| and αmin values of 0.4% and 21°. The systematic change of αmin, however, is difficult to determine due to the low S/N in the small phase angle region. It should be emphasized that both Pmin and αmin depend on illumination or observation geometry (e.g., Lyot 1929; Shkuratov & Ovcharenko 2002; Shkuratov et al. 2025). At oblique incident zenith angles (e.g., i = 6°), polarization curves do not approach zero toward opposition. Moreover, for dielectric powders, the curve shifts to the positive area of polarization, whereas for metal powders it shifts to the negative part (Shkuratov & Ovcharenko 2002). This is clearly visible in Fig. 5.
In the large phase angle region (α>105°), Pmax increases with the increase of iron meteorite content, with a maximum value of 47% for pure iron meteorite. Formally, this obeys the so-called Umov law (e.g., Shkuratov & Ovcharenko 1992; Shkuratov et al. 2025), which is validated even for single particles (Zubko et al. 2011), although the case under consideration here can be more complex. Here, the individual contributions to polarization from metal and dielectric particles can be important when their volumetric proportions change. Notably, as the iron meteorite content increases, αmax shifts toward larger phase angles, from around 122° to near 126°.
Perhaps the most unique polarization feature caused by irradiation is the “squeezing” of polarization in the small phase angle region as shown in Fig. 5. This is caused by the fact that after irradiation, samples with higher iron meteorite content, such as 100% and 80%, have decreased Pmin values, shifting from positive to negative, while other samples show a slight increase in Pmin values, moving from negative to less negative. Except for the pure iron meteorite sample, which still lacks a negative branch of polarization, all other samples have their |Pmin| values moved about 0.4% toward the zero line, with the αinv values clustered around 20°. In the large phase angle region, all samples have their Pmax values increased by approximately 5–10%. The αmax values, however, show no obvious changes after irradiation.
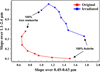 |
Fig. 6 Spectral slope of meteorite mixture samples in VNIR regions. The meteorite mixture samples are represented by interconnected “×” markers, with compositions varying in the following sequence: the proportion of iron meteorites ranges from 0% to 100%, starting from the bottom right corner (specifically 0%, 10%, 20%, 30%, 40%, 60%, 80%, and 100%); the two end members are marked with black arrows. |
4 Discussion
4.1 The effects of metal content in a mixed system on reflectance spectra
Since iron meteorites are primarily composed of metallic Fe-Ni with minimal amounts of other materials (Bouvier et al. 2017), the iron meteorite content in the mixtures can be regarded as the metal content. The spectra shown in Fig. 4 show the metal content appears to be related to the spectral slope for the mixtures. To show this, we plot the VNIR spectral slope in the 1–2.4 μm range versus that in the 0.45–0.63 μm range in Fig. 6. Obviously, as the metal content increases, the visible spectral slope of the mixtures decreases, whereas the near-infrared spectral slope increases. Pulsed laser irradiation increases the overall slope in the VNIR regions but does not change the dependence of spectral slope on metal content.
To compare the VNIR spectra of the mixtures with those of E-type and M-type asteroids with available VNIR spectral data (Tables 2 and 3 in (Zhang et al. 2023)), the spectra of 12 E-type and 14 M-type asteroids are plotted in Fig. 7. The reflectance spectra of both the mixtures and asteroids are normalized to 1 at 0.55 μm. The spectral slopes of the irradiated samples are much larger than those of the asteroids and are therefore not shown here. The comparisons demonstrate that the mixture spectra are unable to closely match those of most asteroids throughout the entire VNIR range. Here, we focus on the variations in spectral slopes in the near-infrared region, as it provides a clearer indication of the influence of metal content. Since the reflectance spectra of many asteroids exhibit a slight inflection around 1.7 μm, we calculated the spectral slopes for the 1.1–1.7 μm and 1.7–2.4 μm ranges separately. Fig. 8 presents the results of selected asteroids and our samples. The near-infrared spectral slopes of most selected E-type asteroids are much smaller than those of the mixtures. A few exceptions were noted. For example, (2035) Stearns exhibits a slope in the 1.1–1.7 μm range comparable to that of the mixture containing 30% iron meteorite. In contrast, (504) Cora shows a markedly steeper slope in the 1.7–2.4 μm range than other asteroids.
For most of the selected M-type asteroids, the mixtures containing 20–100% iron meteorite effectively reproduce their VNIR spectral slopes. However, asteroids (21) Lutetia and (97) Klotho display notably smaller slopes in this range compared to others. It has been suggested that Lutetia’s surface is composed of a mixture of low-FeO silicates and metallic iron (Coradini et al. 2011). However, our results indicate that the metallic iron content may be relatively low. In contrast, asteroid (16) Psyche exhibits an extremely steep slope in 1.7–2.4 μm range, exceeding even that of the pure iron meteorite sample.
4.2 Spectral effects caused by laser irradiation
After laser irradiation, all samples – including FeO-free pure aubrite and the iron meteorite composed of nearly pure Fe–Ni – exhibited reddening and darkening in the VNIR range. It is well known that laser-irradiated iron-bearing silicates can reproduce the spectral effects of micrometeorite impacts on lunar and lunartype materials, primarily due to the formation of nanophase iron particles (npFe0), which are responsible for the observed darkening and reddening (Sasaki et al. 2001; Pieters & Noble 2016). However, for the nearly FeO-free aubrite, it is unlikely to generate sufficient npFe0 particles through pulsed laser irradiation to induce significant spectral alterations. It is possible that a thick amorphous layer, as shown in the SEM images (Fig. 3e), has changed the scattering properties of the host particles. The situation here is probably similar to the laser irradiation on the Norton County meteorite (aubrite) that produced an amorphous rim with a thickness of ~350 nm, but without any npFe0 particles (Zhang et al. 2022b).
For the iron meteorite primarily composed of kamacite (Fe–Ni metals) used in this study, irradiation is unlikely to have caused significant changes in its chemical composition or mineral phases. As shown in Fig. 3, SEM images reveal that the surface of the fresh sample was rough and porous, whereas it became smooth and homogeneous after irradiation. In addition, a large number of discrete, sputtered silicate and metal spheres were observed adhering to the particle surfaces postirradiation. These observations suggest that the alterations in reflectance spectra are more likely caused by changes in the distribution and sizes of Fe–Ni metal particles, or to modifications in surface texture. Previous spectral reflectance measurements of iron meteorite powders with different particle sizes by Cloutis et al. (2010) show that finer particles tend to produce less red spectra. However, as we did not observe any significant particle size increase after irradiation, particle size is unlikely to be a major factor contributing to the observed spectral reddening. Britt & Pieters (1988), in their study of sub-millimeter-scale surface-roughness effects on the bidirectional reflectance spectra of iron meteorites, suggested that surfaces rougher than the incident radiation wavelength exhibit a combination of diffuse and specular reflections, with the latter primarily responsible for the red continuum slope. Based on our SEM observations, the post-irradiation smoothing of particle surfaces likely increased the number of specularly reflecting facets, thereby contributing to the increased red slope in reflectance spectra.
In addition, minor mineral phases present in both aubrite and iron meteorites may also affect their spectral features. For example, the 3 μm absorption band present in aubrite’s spectra suggests a reasonable amount of goethite or other iron hydroxides (Chevrier et al. 2006). Pulsed laser irradiation may interact with these hydrated phases, potentially leading to atypical spectral features. The space weathering response of accessory minerals in iron meteorites, such as schreibersite, troilite, and daubréelite, remain poorly understood and merit further investigation. For instance, laboratory simulations have shown that troilite initially undergoes spectral reddening and brightening under pulsed laser irradiation, but prolonged exposure results in darkening and bluing due to surface topography effects (Prince et al. 2020). Moreover, recent analyses of Itokawa regolith particles revealed that sulfides and silicates exhibit distinct space weathering patterns, even under identical space environmental conditions (Chaves & Thompson 2022).
Another potential source of mutual contamination between dielectric and metallic components is the formation of vapor clouds generated by laser irradiation. The atoms released during these high-energy events can form heated vapor clouds that expand into the surrounding area, as rebounding atoms collide with nearby surfaces, leading to widespread deposition and mixing (Starukhina et al. 1999).
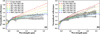 |
Fig. 7 VNIR spectra of meteorite mixture samples and E- (left) and M-type (right) asteroids. The spectra of the asteroids are shown as solid gray lines, while the spectra of the meteorite mixture samples are represented by dashed colored lines. |
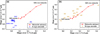 |
Fig. 8 Comparison of spectral slope in near-infrared range for meteorite mixture samples with E- (left) and M-type (right) asteroids. The meteorite mixture samples are represented by interconnected red “×” markers, with compositions varying in the same sequence as in Fig. 6. Asteroids are represented by colored numbers corresponding to their designation. |
4.3 Specular reflection effects in metal-rich objects
For metal-rich objects, the macroscopic surface structure clearly plays a critical role in determining optical properties. Cloutis et al. (2010) demonstrated that reducing surface roughness on iron meteorite slabs increases overall reflectance and decreases the near-infrared spectral slope. Similarly, Zhang et al. (2023) conducted laser irradiation experiments on a III-AB iron meteorite fragment and observed surface smoothing accompanied by spectral brightening and bluing. In contrast, our experiments showed consistent darkening and reddening across all samples in the VNIR spectra after irradiation, even for those with high iron content. No spectral brightening or bluing was observed. We conjecture that this discrepancy may arise from the unique specular reflection behavior of metallic materials. In bulk samples, pulsed laser irradiation can induce localized melting of metal, leading to the formation of smooth, specular surfaces that enhance reflectance and reduce spectral slope. However, in powdered samples, molten droplets formed during irradiation are dispersed and unable to coalesce into larger, smooth regions, thus preventing the development of significant specular reflection effects.
For the largest M-type asteroid, (16) Psyche, whose surface has long been hypothesized to exhibit compositional and structural heterogeneity (Cambioni et al. 2022; Castro-Chacón et al. 2022), it is plausible that both scenarios exist. Regions with extensive exposed metallic surfaces and areas covered by fine-grained regolith may develop markedly different optical properties, even under identical space weathering conditions. However, quantitatively assessing the contribution of specular reflection to the overall optical behavior of metal-rich asteroid surfaces remains a challenge and warrants further laboratory investigations including laboratory simulations.
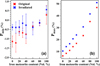 |
Fig. 9 Pmin (a) and Pmax (b) variations with metal content in meteorite mixture sample. Samples before and after weathering are indicated by red and blue “×” markers, respectively. The measurement uncertainties of Pmax are too small to be seen. |
4.4 Polarization parameters and metal content
To look at the relationship between iron content and Pmin and Pmax, we plot Pmin and Pmax as functions of iron content in Fig. 9. These plots show a clear dependence of both Pmin and Pmax on iron content in the meteorite mixtures; both parameters increase as the iron content increases. A comparison with Fig. 6 shows that the monotonic increase in Pmin and Pmax aligns with the trend of spectral reddening observed in the VNIR spectra as metal content increases. This result is consistent with astronomical observations of 31 M/X-type asteroids, which show that |Pmin| increases as the near-infrared spectral slope decreases (Belskaya et al. 2022). Together, these findings suggest that both the near-infrared spectral slope and |Pmin| are sensitive indicators of metal content. The combination of these two parameters may serve as a diagnostic tool for assessing the metal content of object surfaces composed of silicate-metal mixtures.
To compare the polarization parameters of the mixtures measured in this study with those of relevant asteroids, we plot Pmin versus αinv for the mixtures, overlaid on asteroid data from Belskaya et al. (2017) in Fig. 10. The “squeezing” of the polarization curves shown in Fig. 5 is also evident in Fig. 10. Since the pure iron meteorite exhibited no negative polarization, it is not included in this figure. Samples with a high aubrite content exhibit large |Pmin| and αinv. Interestingly, the laser-irradiated mixtures, regardless of composition, cluster within the region occupied by E-type asteroids. This suggests that space weathering may complicate the spectral classification of asteroids based solely on polarization parameters, particularly for objects with varying metal-to-silicate ratios.
Although the physical mechanisms underlying planetary polarization phenomena are not fully understood, extensive theoretical and experimental studies have shown that the negative polarization branch may be influenced by many factors, including surface composition and texture (Belskaya et al. 2015; Bagnulo et al. 2024). However, the relative contributions of these factors remain unclear. Consequently, the use of Pmin and αinv to infer surface composition can only be considered qualitative or, at best, semi-quantitative. For instance, under controlled laboratory conditions where variables such as particle size and illumination-observation geometry are fixed, Pmin can serve as an indicator of relative metal content among samples. On real planetary surfaces, however, regolith properties are largely unknown, making it difficult to place definitive compositional constraints based solely on polarization data. In such cases, polarimetric measurements are better used to complement spectral analyses.
In astronomical observations, polarimetric parameters within the negative polarization branch (e.g., Pmin and αinv) are accessible for both main-belt and near-Earth asteroids (NEAs). In addition, NEAs are often observed at larger phase angles, enabling the measurement of Pmax as well. Therefore, while polarimetric parameters provide useful supplementary constraints on surface composition for both asteroid populations, the availability of more complete polarization phase curves for NEAs makes such analyses more robust and informative in their case.
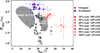 |
Fig. 10 Distributions of Pmin and αinv parameters for samples before and after irradiations. The asteroid data are taken from Belskaya et al. (2017). |
5 Conclusions
We prepared particulate mixtures of aubrite and iron meteorites in varying proportions and performed pulsed laser irradiation to simulate micrometeorite impacts. Scanning electron microscopy, reflectance spectra, bidirectional reflectance, and polarization measurements were carried out on the samples before and after irradiation. The goal was to understand the optical effects of metal content in the silicate-metal mixture system and the modifications induced by pulsed laser irradiation. The key findings are listed as follows:
- (1)
In general, the near-infrared spectral slope of silicatemetal mixtures increased with metal content. The presence of metal suppressed the 3 μm absorption band associated with hydrated silicates, but had little effect on the mid-infrared absorption features of silicates. Pulsed laser irradiation increased the overall VNIR spectral slope, yet did not alter the dependence of spectral slope on metal content;
- (2)
The surface structure of metal-rich objects affected their response to pulsed laser irradiation. The spectrum of iron meteorite powder became darker and redder after pulsed laser irradiation, contrasting with the changes previously observed in bulk samples. This discrepancy may be attributed to variations in microscopic-scale surface roughness and the influence of specular reflections;
- (3)
As the iron meteorite content in the mixtures increased, reflectance in the principal plane increased, whereas reflectance out of the principal plane decreased. Pulsed laser irradiation reduced forward scattering and enhanced back scattering, a trend that was particularly pronounced in samples with high metal content;
- (4)
Aubrite-iron meteorite mixtures exhibited near-infrared slopes comparable to those of many M-type and some E-type asteroids. The wide range of spectral slopes observed among M-type asteroids may reflect significant variability in their metal content;
- (5)
Both the extreme values of polarization curves, Pmin and Pmax, and the near-infrared spectral slopes of the meteorite mixtures showed a strong dependence on metal content. Therefore, the combination of these optical parameters may have potential for estimating the metal content of silicate–metal mixed asteroids;
- (6)
Pulsed laser irradiation reduced the degree of linear polarization at small phase angles, producing a “squeezing effect” on the polarization curves. As a result, the relationship between Pmin and αinv for the irradiated samples remained confined to the E-type asteroid domain in the Pmin–αinv plot. This suggests that space weathering may complicate asteroidal spectral classification based on polarization parameters, particularly for objects with varying metal-to-silicate ratios.
Acknowledgements
This work was supported by the National Natural Science Foundation of China (12373067, 42273042, U24A2008) and Macau University of Science and Technology (SKL-LPS(MUST)-2021-2023).
References
- Bagnulo, S., Belskaya, I., Cellino, A., et al. 2024, A&ARv, 32, 7 [Google Scholar]
- Belskaya, I. N., Fornasier, S., Krugly, Yu. N., et al. 2010, A&A, 515, A29 [NASA ADS] [CrossRef] [EDP Sciences] [Google Scholar]
- Belskaya, I., Cellino, A., Gil-Hutton, R., Muinonen, K., & Shkuratov, Y. 2015, in Asteroids IV, eds. P. Michel, F. E. DeMeo, & W. F. Bottke (University of Arizona Press, Tucson), 151 [Google Scholar]
- Belskaya, I., Fornasier, S., Tozzi, G., et al. 2017, Icarus, 284, 30 [NASA ADS] [CrossRef] [Google Scholar]
- Belskaya, I., Berdyugin, A., Krugly, Y., et al. 2021, in European Planetary Science Congress, 15, EPSC2021-359 [Google Scholar]
- Belskaya, I., Berdyugin, A., Krugly, Yu., et al. 2022, A&A, 663, A146 [NASA ADS] [CrossRef] [EDP Sciences] [Google Scholar]
- Belskaya, I., Berdyugin, A., Krugly, Y., et al. 2024, in European Planetary Science Congress, 17, EPSC2024-898 [Google Scholar]
- Bouvier, A., Gattacceca, J., Grossman, J., & Metzler, K. 2017, Meteorit. Planet. Sci., 52, 2411 [Google Scholar]
- Britt, D. T., & Pieters, C. M. 1988, in Lunar Planet. Sci., 18, 503, 18th Lunar and Planetary Science Conference, March 16–20, 1987, Houston, TX [Google Scholar]
- Cambioni, S., De Kleer, K., & Shepard, M. 2022, J. Geophys. Res. Planets, 127, e2021JE007091 [Google Scholar]
- Cantillo, D. C., Reddy, V., Sharkey, B. N. L., et al. 2021, Planet. Sci. J., 2, 95 [Google Scholar]
- Castro-Chacón, J., Gil-Hutton, R., Vélez, J. R., & Reyes-Ruiz, M. 2022, Planet. Space Sci., 213, 105428 [CrossRef] [Google Scholar]
- Chaves, L. C., & Thompson, M. S. 2022, Earth Planets Space, 74, 124 [Google Scholar]
- Chevrier, V., Roy, R., Le Mouélic, S., et al. 2006, Planet. Space Sci., 54, 1034 [Google Scholar]
- Clark, B. E., Bus, S. J., Rivkin, A. S., et al. 2004a, J. Geophys. Res. Planets, 109, 2003JE002200 [Google Scholar]
- Clark, B. E., Bus, S. J., Rivkin, A. S., Shepard, M. K., & Shah, S. 2004b, AJ, 128, 3070 [Google Scholar]
- Cloutis, E. A., & Gaffey, M. J. 1993, Earth Moon Planets, 63, 227 [Google Scholar]
- Cloutis, E. A., Hardersen, P. S., Bish, D. L., et al. 2010, Meteorit. Planet. Sci., 45, 304 [Google Scholar]
- Coradini, A., Capaccioni, F., Erard, S., et al. 2011, Science, 334, 492 [Google Scholar]
- Dollfus, A., Mandeville, J.-C., & Duseaux, M. 1979, Icarus, 37, 124 [NASA ADS] [CrossRef] [Google Scholar]
- Dollfus, A., Wolff, M., Geake, J. E., Lupishko, D. F., & Dougherty, L. M. 1989, in Asteroids II, eds. R. P. Binzel, T. Gehrels, & M. S. Matthews (University of Arizona Press, Tucson), 594 [Google Scholar]
- Elkins-Tanton, L. T., Asphaug, E., Bell, J. F., et al. 2020, J. Geophys. Res. Planets, 125, e2019JE006296 [Google Scholar]
- Fornasier, S., Migliorini, A., Dotto, E., & Barucci, M. 2008, Icarus, 196, 119 [NASA ADS] [CrossRef] [Google Scholar]
- Fornasier, S., Clark, B., Dotto, E., et al. 2010, Icarus, 210, 655 [NASA ADS] [CrossRef] [Google Scholar]
- Fornasier, S., Clark, B., & Dotto, E. 2011, Icarus, 214, 131 [NASA ADS] [CrossRef] [Google Scholar]
- Gaffey, M. J. 1976, J. Geophys. Res., 81, 905 [NASA ADS] [CrossRef] [Google Scholar]
- Gaffey, J. D., & Wu, C. S. 1989, J. Geophys. Res. Space Phys., 94, 8685 [Google Scholar]
- Gil-Hutton, R. 2007, A&A, 464, 1127 [CrossRef] [EDP Sciences] [Google Scholar]
- Hadamcik, E., Levasseur-Regourd, A., Renard, J.-B., Lasue, J., & Sen, A. 2011, J. Quant. Spectrosc. Radiat. Transf., 112, 1881 [Google Scholar]
- Hapke, B. 2012, Theory of Reflectance and Emittance Spectroscopy (Cambridge: Cambridge University Press) [Google Scholar]
- Hardersen, P., Gaffey, M., & Abell, P. 2005, Icarus, 175, 141 [NASA ADS] [CrossRef] [Google Scholar]
- Jiang, T., Zhang, H., Yang, Y., et al. 2019, Icarus, 331, 127 [CrossRef] [Google Scholar]
- Jiang, T., Zhang, H., Yang, Y., et al. 2022, Rev. Sci. Instrum., 93, 024504 [Google Scholar]
- Li, J.-Y., Helfenstein, P., Buratti, B., Takir, D., & Clark, B. E. 2015, in Asteroids IV, eds. P. Michel, F. E. DeMeo, & W. F. Bottke (Univ. Arizona Press, Tucson), 277 [Google Scholar]
- Lumme, K., & Bowell, E. 1981, AJ, 86, 1694 [Google Scholar]
- Lyot, B. 1929, Ann. Obs. Meudon, 8, 1 [Google Scholar]
- Mothé-Diniz, T., árcio Carvano, J. M., & Lazzaro, D. 2003, Icarus, 162, 10 [CrossRef] [Google Scholar]
- Muinonen, K., Piironen, J., Shkuratov, Y. G., Ovcharenko, A., & Clark, B. E. 2002, in Asteroids III, eds. W. F. Bottke, A. Cellino, P. Paolicchi, & R. P. Binzel (Tucson: University of Arizona Press), 123 [Google Scholar]
- Ockert-Bell, M., Clark, B., Shepard, M., et al. 2010, Icarus, 210, 674 [CrossRef] [Google Scholar]
- Pan, K.-S., & Ip, W.-H. 2022, Planet. Space Sci., 212, 105412 [Google Scholar]
- Pieters, C. M., & Noble, S. K. 2016, J. Geophys. Res. Planets, 121, 1865 [CrossRef] [Google Scholar]
- Prince, B. S., Magnuson, M. P., Chaves, L. C., Thompson, M. S., & Loeffler, M. J. 2020, J. Geophys. Res. Planets, 125, e2019JE006242 [Google Scholar]
- Sasaki, S., Nakamura, K., Hamabe, Y., Kurahashi, E., & Hiroi, T. 2001, Nature, 410, 555 [NASA ADS] [CrossRef] [Google Scholar]
- Shkuratov, Y. G., & Opanasenko, N. V. 1992, Icarus, 99, 468 [NASA ADS] [CrossRef] [Google Scholar]
- Shkuratov, Y. G., & Ovcharenko, A. V. 2002, in Optics of Cosmic Dust, eds. G. Videen & M. Kocifaj (Springer), 225 [Google Scholar]
- Shkuratov, Y. G., Opanasenko, N. V., & Kreslavsky, M. A. 1992, Icarus, 95, 283 [NASA ADS] [CrossRef] [Google Scholar]
- Shkuratov, Y. G., Kreslavsky, M. A., Ovcharenko, A. A., et al. 1999, Icarus, 141, 132 [NASA ADS] [CrossRef] [Google Scholar]
- Shkuratov, Y. G., Kaydash, V., & Videen, G. 2025, Optics of the Moon (Amsterdam: Elsevier) [Google Scholar]
- Starukhina, L. V., Shkuratov, Y. G., & Skorik, S. K. 1999, Sol. Syst. Res., 33, 212 [Google Scholar]
- Sun, Z., Zhang, J., Tong, Z., & Zhao, Y. 2014, J. Quant. Spectrosc. Radiat. Transf., 133, 1 [Google Scholar]
- Tholen, D. J. 1984, PhD thesis, Univ. Arizona, Tucson [Google Scholar]
- Vilas, F., Jarvis, K. S., & Gaffey, M. J. 1994, Icarus, 109, 274 [NASA ADS] [CrossRef] [Google Scholar]
- Voss, K. J., & Zhang, H. 2006, Appl. Opt., 45, 7924 [Google Scholar]
- Watters, T. R., & Prinz, M. 1979, in Lunar Planet. Sci., 10, 1073, 10th Lunar and Planetary Science Conference, March 19–23, 1979, Houston, TX [Google Scholar]
- Yamada, M., Sasaki, S., Nagahara, H., et al. 1999, Earth Planets Space, 51, 1255 [NASA ADS] [CrossRef] [Google Scholar]
- Yang, Y., Zhang, H., Wang, Z., et al. 2017, A&A, 597, A50 [NASA ADS] [CrossRef] [EDP Sciences] [Google Scholar]
- Zellner, B., Leake, M., Morrison, D., & Williams, J. 1977, Geochim. Cosmochim. Acta, 41, 1759 [NASA ADS] [CrossRef] [Google Scholar]
- Zhang, H., Jin, W., Jiang, T., Yang, Y., & Ma, P. 2022a, in Springer Series in Light Scattering, 8: Light Polarization and Multiple Scattering in Turbid Media (Springer), 47 [Google Scholar]
- Zhang, P., Tai, K., Li, Y., et al. 2022b, A&A, 659, A78 [NASA ADS] [CrossRef] [EDP Sciences] [Google Scholar]
- Zhang, P., Li, Y., Zhang, J., et al. 2023, A&A, 671, A77 [NASA ADS] [CrossRef] [EDP Sciences] [Google Scholar]
- Zheng, H., Zhang, H., Shkuratov, Y., & Britt, D. 2025, Opt. Express, 33, 7942 [Google Scholar]
- Zubko, E., Videen, G., Shkuratov, Y., Muinonen, K., & Yamamoto, T. 2011, Icarus, 212, 403 [Google Scholar]
Appendix A Photographs of the samples
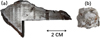 |
Fig. A1 Photos of the meteorite fragments. (a) the “Aletai” iron meteorite. (b) the “Norton County” aubrite. |
Volume percentages and photos of the original and laser-irradiated (30 mJ ×6 shots) meteorite mixtures.
Appendix B Data processing and error analysis of the polarization-phase curve measurement
Since the raw polarization curves were noisy, we smoothed I∥ and I⊥ with a binomial algorithm before calculating P, thereby reducing anomalous points while preserving the overall trend. Fig. B1 shows the averaged values (markers with lines) and the uncertainties, taken as deviations from the mean (shaded areas), derived from two measurement runs with independent sample loadings, as described in Subsection 2.5.
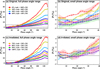 |
Fig. B1 Smoothed data of the polarization curves of all mixture samples. The colored shadows around the lines represent the deviations from the mean of two measurement runs over two independent surface realizations. (b) and (d) are enlargements of the small phase angle regions outlined in (a) and (c), respectively. |
Next, we performed polynomial fitting on the smoothed polarization curves. This interpolation process increases the density of data points, allowing us to more precisely determine the locations of key polarization parameters. Fig. B2 displays the raw data, the smoothed data, and the polynomial fits to the smoothed curves for the laser-irradiated mixture sample consisting of 80% aubrite and 20% iron meteorite.
Due to the distinct angular behaviors of the polarization curves at small and large phase angles, we applied a 3-term (cubic) polynomial fit in the 0–50° range and a 4-term (quintic) polynomial fit in the 105–130° range. This approach effectively reduces oscillations in the original data while preserving the overall shape. The fitting errors are within approximately 3° for αinv and within approximately 0.5% for Pmin.
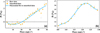 |
Fig. B2 The raw data, binomial-smoothed data, and polynomial fits to binomial-smoothed data for pulsed-laser-irradiated mixture of 80% aubrite + 20% iron meteorite.(a) Small phase angle region. (b) Large phase angle region. |
Appendix C BRDF results
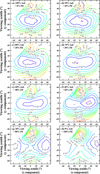 |
Fig. C1 REFF contour plots in 633 nm of the original samples measured at 40° incident zenith. In each contour plot, the origin (x=0°,y=0°) represents the nadir direction (viewing straight down) and the radial distance from the origin corresponds to the zenith angle. The incident beam is aligned with the positive y-axis, which serves as the azimuthal reference direction (0° azimuth). Relative azimuth angles are measured clockwise from this reference. |
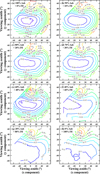 |
Fig. C2 REFF contour plots in 633 nm of irradiated samples measured at 40° incidence. In each contour plot, the origin (x=0°,y=0°) represents the nadir direction (viewing straight down) and the radial distance from the origin corresponds to the zenith angle. The incident beam is aligned with the positive y-axis, which serves as the azimuthal reference direction (0° azimuth). Relative azimuth angles are measured clockwise from this reference. |
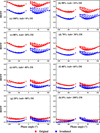 |
Fig. C3 REFF versus phase angle in 633 nm of all samples. The incident light has an azimuth angle of 0° and a zenith angle of 40° The positive and negative phase angles indicate the azimuth angle is within [0°, 180°] and [180°, 360°], respectively. The plots look asymmetrical for the positive and negative phase angle regions because there are more measurement data points in the positive phase angle region, where the relative azimuth angle is between [0°, 180°]. |
All Tables
Volume percentages and photos of the original and laser-irradiated (30 mJ ×6 shots) meteorite mixtures.
All Figures
|
Fig. 1 Schematic diagram of key parameters in polarization-phase curve. |
| In the text | |
|
Fig. 2 Schematic of pulsed laser irradiation system. The entire system is mounted on an optical table. |
| In the text | |
|
Fig. 3 SEM images of meteorite mixture samples before and after laser irradiation. (a) Backscattered electron image of the original aubrite-iron meteorite mixture. (b) Secondary electron image of an original aubrite particle. (c) Secondary electron image of an original iron-meteorite particle. (d) Backscattered electron image of the irradiated aubrite-iron meteorite mixture. (e) Secondary electron image of an irradiated aubrite particle. (f) Backscattered electron image of an irradiated iron-meteorite particle. |
| In the text | |
|
Fig. 4 Spectral reflectance from 0.35 to 25 μm of original (a) and irradiated (c) meteorite mixture samples. The spectra, normalized at 0.55 μm, are presented in (b) and (d). Samples of different compositions are represented by different colors. Solid lines correspond to fresh samples, while the dashed lines in (c) and (d) represent irradiated samples. In the legend, Aub denotes aubrite, and IM denotes iron meteorite. The same notations are used in all subsequent figures. |
| In the text | |
|
Fig. 5 Polarization curves of meteorite mixture samples before and after irradiation, measured at a 60° incident zenith. Panels (b) and (d) are magnified areas outlined by the dotted boxes in (a) and (c), respectively. Gray triangles are measurement data and colored lines are fit curves. |
| In the text | |
|
Fig. 6 Spectral slope of meteorite mixture samples in VNIR regions. The meteorite mixture samples are represented by interconnected “×” markers, with compositions varying in the following sequence: the proportion of iron meteorites ranges from 0% to 100%, starting from the bottom right corner (specifically 0%, 10%, 20%, 30%, 40%, 60%, 80%, and 100%); the two end members are marked with black arrows. |
| In the text | |
|
Fig. 7 VNIR spectra of meteorite mixture samples and E- (left) and M-type (right) asteroids. The spectra of the asteroids are shown as solid gray lines, while the spectra of the meteorite mixture samples are represented by dashed colored lines. |
| In the text | |
|
Fig. 8 Comparison of spectral slope in near-infrared range for meteorite mixture samples with E- (left) and M-type (right) asteroids. The meteorite mixture samples are represented by interconnected red “×” markers, with compositions varying in the same sequence as in Fig. 6. Asteroids are represented by colored numbers corresponding to their designation. |
| In the text | |
|
Fig. 9 Pmin (a) and Pmax (b) variations with metal content in meteorite mixture sample. Samples before and after weathering are indicated by red and blue “×” markers, respectively. The measurement uncertainties of Pmax are too small to be seen. |
| In the text | |
|
Fig. 10 Distributions of Pmin and αinv parameters for samples before and after irradiations. The asteroid data are taken from Belskaya et al. (2017). |
| In the text | |
|
Fig. A1 Photos of the meteorite fragments. (a) the “Aletai” iron meteorite. (b) the “Norton County” aubrite. |
| In the text | |
|
Fig. B1 Smoothed data of the polarization curves of all mixture samples. The colored shadows around the lines represent the deviations from the mean of two measurement runs over two independent surface realizations. (b) and (d) are enlargements of the small phase angle regions outlined in (a) and (c), respectively. |
| In the text | |
|
Fig. B2 The raw data, binomial-smoothed data, and polynomial fits to binomial-smoothed data for pulsed-laser-irradiated mixture of 80% aubrite + 20% iron meteorite.(a) Small phase angle region. (b) Large phase angle region. |
| In the text | |
|
Fig. C1 REFF contour plots in 633 nm of the original samples measured at 40° incident zenith. In each contour plot, the origin (x=0°,y=0°) represents the nadir direction (viewing straight down) and the radial distance from the origin corresponds to the zenith angle. The incident beam is aligned with the positive y-axis, which serves as the azimuthal reference direction (0° azimuth). Relative azimuth angles are measured clockwise from this reference. |
| In the text | |
|
Fig. C2 REFF contour plots in 633 nm of irradiated samples measured at 40° incidence. In each contour plot, the origin (x=0°,y=0°) represents the nadir direction (viewing straight down) and the radial distance from the origin corresponds to the zenith angle. The incident beam is aligned with the positive y-axis, which serves as the azimuthal reference direction (0° azimuth). Relative azimuth angles are measured clockwise from this reference. |
| In the text | |
|
Fig. C3 REFF versus phase angle in 633 nm of all samples. The incident light has an azimuth angle of 0° and a zenith angle of 40° The positive and negative phase angles indicate the azimuth angle is within [0°, 180°] and [180°, 360°], respectively. The plots look asymmetrical for the positive and negative phase angle regions because there are more measurement data points in the positive phase angle region, where the relative azimuth angle is between [0°, 180°]. |
| In the text | |
Current usage metrics show cumulative count of Article Views (full-text article views including HTML views, PDF and ePub downloads, according to the available data) and Abstracts Views on Vision4Press platform.
Data correspond to usage on the plateform after 2015. The current usage metrics is available 48-96 hours after online publication and is updated daily on week days.
Initial download of the metrics may take a while.