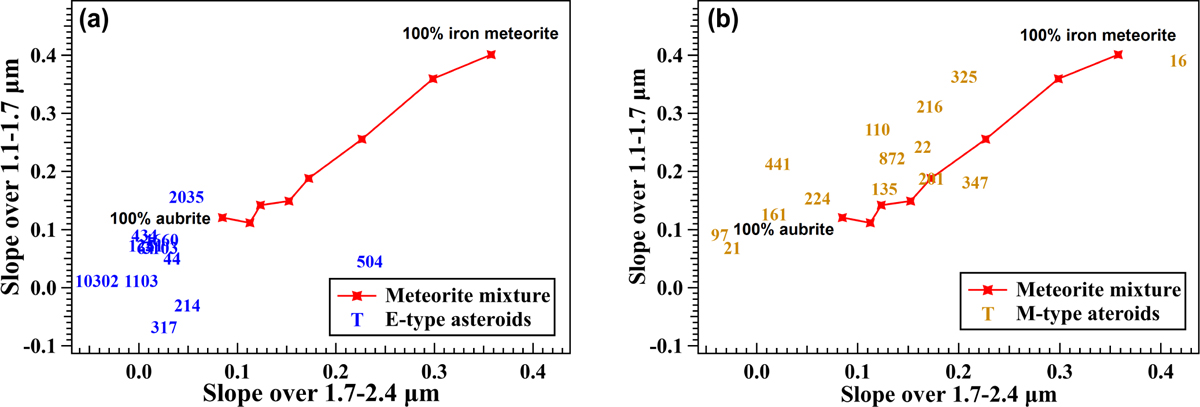
Fig. 8
Download original image
Comparison of spectral slope in near-infrared range for meteorite mixture samples with E- (left) and M-type (right) asteroids. The meteorite mixture samples are represented by interconnected red “×” markers, with compositions varying in the same sequence as in Fig. 6. Asteroids are represented by colored numbers corresponding to their designation.
Current usage metrics show cumulative count of Article Views (full-text article views including HTML views, PDF and ePub downloads, according to the available data) and Abstracts Views on Vision4Press platform.
Data correspond to usage on the plateform after 2015. The current usage metrics is available 48-96 hours after online publication and is updated daily on week days.
Initial download of the metrics may take a while.