Open Access
Fig. 2
Download original image
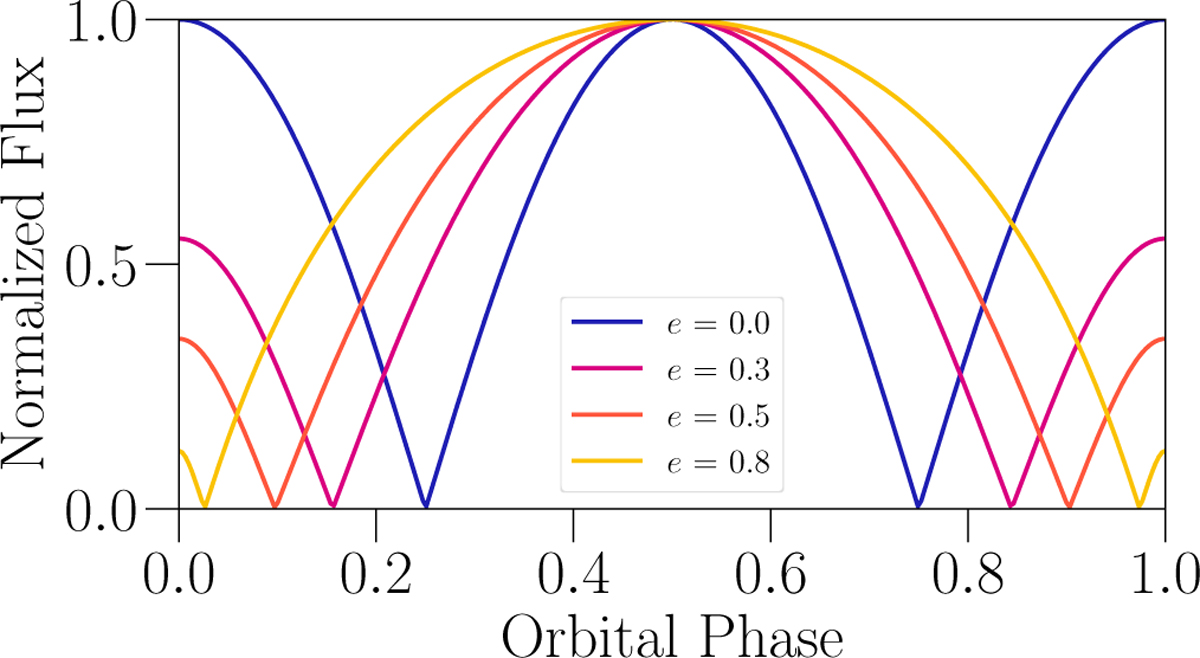
Synthetic light curves showing incoming flux to a polar-aligned disk as a function of binary orbital phase, plotted for various binary eccentricities. All curves have been normalized to their peak brightness value, which occurs at binary apocenter.
Current usage metrics show cumulative count of Article Views (full-text article views including HTML views, PDF and ePub downloads, according to the available data) and Abstracts Views on Vision4Press platform.
Data correspond to usage on the plateform after 2015. The current usage metrics is available 48-96 hours after online publication and is updated daily on week days.
Initial download of the metrics may take a while.