| Issue |
A&A
Volume 704, December 2025
|
|
|---|---|---|
| Article Number | A217 | |
| Number of page(s) | 10 | |
| Section | Interstellar and circumstellar matter | |
| DOI | https://doi.org/10.1051/0004-6361/202555615 | |
| Published online | 16 December 2025 | |
Brightness variability in polar circumbinary disks
1
Dipartimento di Fisica, Università degli Studi di Milano,
Via Celoria 16,
20133
Milano,
Italy
2
Department of Physics and Astronomy, University of Nevada,
Las Vegas 4505 S. Maryland Parkway,
Las Vegas,
NV
89154,
USA
★ Corresponding author: This email address is being protected from spambots. You need JavaScript enabled to view it.
Received:
21
May
2025
Accepted:
29
October
2025
Abstract
In binary systems with a strongly misaligned disk, the central binary stars can travel a significant vertical distance above and below the disk’s orbital plane. This can cause large changes in illumination of the disk over the course of the binary orbital period. We use both analytic and radiative transfer models to examine the effect of changes in stellar illumination on the appearance of the disk, specifically in the case of the polar disk HD 98800B. We find that the observed flux from the disk can vary significantly over the binary orbital period, producing a periodically varying light curve that peaks twice each binary orbit. The amount of flux variation is strongly influenced by the disk geometry. We suggest that these flux variations produce several observable signatures, and that these observables may provide constraints on different properties of the disk, such as its vertical structure, geometry, and cooling rate.
Key words: accretion, accretion disks / radiation mechanisms: general / radiative transfer / protoplanetary disks / binaries: general / stars: individual: HD 98800
© The Authors 2025
 Open Access article, published by EDP Sciences, under the terms of the Creative Commons Attribution License (https://creativecommons.org/licenses/by/4.0), which permits unrestricted use, distribution, and reproduction in any medium, provided the original work is properly cited.
This article is published in open access under the Subscribe to Open model. This email address is being protected from spambots. You need JavaScript enabled to view it. to support open access publication.
1 Introduction
In recent years, the number of protoplanetary disks observed in multistar systems has increased dramatically. These systems include disks in binary systems (HD 142527; Avenhaus et al. 2014, 2017), triple systems (GW Orionis; Kraus et al. 2020), and systems of even higher multiplicity (GG Tau; Di Folco et al. 2014; Keppler et al. 2020). The presence of more stars in these systems increases the complexity of the star-disk dynamics, generating new behaviors in the disk and providing additional probes into the nature of protoplanetary disks when combined with single-star observations.
For a handful of these systems, the orientation of both the disk and stellar orbital planes can be measured using a combination of millimeter-wavelength and astrometric observations, allowing for measurement of the misalignment between the two planes. The observed misalignment angles are mostly coplanar for small binaries, but they become increasingly misaligned for wider or more eccentric binaries (Czekala et al. 2019), including disks in “polar” orbits, which have a misalignment angle close to 90°. In a circumbinary disk, such a configuration can naturally arise and remain in a stable configuration as long as the central binary is eccentric (Verrier & Evans 2009; Farago & Laskar 2010). The evolution towards polar alignment in a highly inclined circumbinary disk has been studied carefully in many previous works (Aly et al. 2015; Martin & Lubow 2017, 2018; Rabago et al. 2023). For higher-order systems, the evolution of the disk is more complicated due to additional effects from the interacting bodies, but analytical results seem to suggest a certain amount of misalignment in these systems (Ceppi et al. 2023; Lepp et al. 2023).
Disks such as 99 Herculis (Kennedy et al. 2012), HD 98800B (Kennedy et al. 2019), V773 Tau B (Kenworthy et al. 2022), and Bernahrd-2 (Hu et al. 2024) are thought to be examples of disks in a polar orientation. The HD 98800 quadruple system, consisting of a double binary pair (Walker & Wolstencroft 1988), is the clearest example of a polar-aligned disk due to recent ALMA observations directly resolving the circumbinary disk around the B binary (Kennedy et al. 2019). The observed orientation of the disk is consistent with a configuration that is only a few degrees away from exactly polar.
Polar disks offer a unique configuration in which the high misalignment of the binary and disk planes allows the central stars to gain significant vertical distances above and below the disk as the stars orbit. This added vertical motion can greatly change the amount of light received across the face of the disk, resulting in significant changes in the appearance of the disk over the course of the binary orbital period. This suggests an innate source of variability in systems with a polar-aligned disk, originating from periodic motion of the central binary.
In this paper, we examine how the movement of the central binary changes the illumination of the surrounding circumbinary disk. We focus on the case of a polar disk to consider the case of maximum misalignment between the binary and disk planes. The paper is organized as follows. In Section 2 we examine the analytical variations in stellar flux received by the disk over the course of the binary orbital period. In Section 3 we perform radiative transfer calculations for a disk in a polar configuration. We discuss our results in Section 5 and conclude in Section 6.
2 Numerical light curves
In this section we derive a numerical model for the amount of illumination received by the disk. We consider the arrangement of equal-mass point sources (the binary) with separation a and eccentricity e and a surrounding polar-aligned annulus of material (the disk). Polar alignment occurs when the disk angular momentum vector aligns with the binary eccentricity vector. In the following discussion, we place the binary-disk system with the geometric center at the origin, and orient the system such that the disk lies along the xy-plane and the binary major axis and eccentricity vector lie in the z direction. Without loss of generality, we take the plane of the binary orbit to be in the xz-plane.
We considered a disk with a radial extent of 2a to 5a, similar to the polar disk of HD 98800B (Kennedy et al. 2019). The inner radial limit was determined by the truncation of the central binary, and is slightly smaller than the expected inner cavity for coplanar circumbinary disks (Miranda & Lai 2015; Franchini et al. 2019); the outer radius of HD 98800B sits at around 5a, and is likely truncated by the orbit of the AaAb binary (Zúñiga-Fernández et al. 2021). When calculating the stellar flux onto the disk, we considered the stars to be point-like sources.
The incoming stellar flux across the entire disk is given by:
 (1)
(1)
where F* is the flux from the stellar surface,  is the distance from the star to a point on the disk, and θ is the angle between the star and the normal of the disk surface in question (τ = 1 surface, scattering surface, etc.). In this equation, d and θ are functions of both the location on the disk and the position of the illuminating star, as well as a function of time as the star moves along its orbit. In the following sections, we discuss some specific disk models and the important features of each.
2.1 Thin disk
We start with a simple model of a razor-thin disk, h/r ≪ 1. In this case, the disk surface is coincident with the xy-plane, and the disk normal points vertically in the z direction. At large distances from the binary, the lateral motion of the stars in the direction of the disk plane is negligible, and we can assume the star lies along the z-axis, so the flux contribution at each point takes the form:
 (2)
(2)
where z is the vertical distance of the star above the disk plane. Thus, similar to a dipole, the incoming flux should decay as the cube of the radial distance. Inner regions of the disk are expected to receive substantially more radiation, as the stellar flux can be angled more directly onto the disk surface during the apocenter of the binary. As binary eccentricity increases, both the apocenter distance a(1 + e) and the fraction of time the stars spend close to apocenter increase, so we expect the effects of face-on radiation to increase for higher eccentricity binaries.
To examine how the incoming stellar flux changes as the stars move, we numerically calculated the flux across the disk over the binary orbital period. Using Kepler’s equation, we solved for the positions of the binary components at 1000 evenly spaced points in time (i.e., evenly spaced in the mean anomaly M) and used Equation (1) to calculate the total flux onto the disk at each time. Following the convention used for orbital astrometry, we normalized the orbital period of the binary from zero to one, with t = 0 representing the time of pericenter passage for the binary system. Note that for these calculations, we assumed the disk to be opaque and considered the light of only one star at a time for one side of the disk. Depending on the optical depth of the disk, radiation from both stars may contribute to the total illumination in a more realistic scenario. For an equal-mass binary with stars of roughly the same temperature, the results should change by a factor of two at most.
Figure 1 shows the flux onto the disk at different points of the binary orbit for an equal-mass central binary with eccentricity e = 0.5. Notably, the minimum brightness does not occur at binary pericenter as one might expect. Although the stars are at their closest, they are both vertically offset from their center of mass, allowing them to illuminate a small amount of the surface of the disk (first column). The minimum illumination instead occurs slightly before and after the pericenter (second column), when the binary stars pass through the disk plane. At these times, which we refer to hereafter as disk plane crossings, the stellar flux runs parallel to the disk, and in our razor-thin approximation, the illumination drops to zero. As the stars continue in the orbit (third column), their vertical and horizontal distance from the system center increases, and the disk brightens considerably as the star now shines down onto the face of the disk directly. The lateral displacement of the stars at midorbit creates an asymmetric illumination pattern along the axis of the binary plane. Finally, as the stars reach the apocenter, the horizontal displacement vanishes, leaving a symmetric, brightly illuminated disk (fourth column).
Figure 2 shows the total stellar flux on the disk for various initial binary eccentricities. The light curve of the binary is split unevenly into two peaks corresponding to the two orbital arcs on either side of the disk, covering the binary pericenter (phase=0) and apocenter (phase=0.5). In the limit of a circular binary (e = 0), the flux shows regular periodicity at exactly half the binary orbital period. The incoming flux drops to zero twice each binary orbit, corresponding to the two disk plane crossings. As the binary eccentricity increases, both the periodicity and the amplitude of the flux become increasingly uneven. The peak at the binary apocenter grows in amplitude and duration, while the peak at the binary pericenter shrinks. For a binary with an eccentricity of e = 0.5, the passage through pericenter takes about 20% of the total orbital period, while the arc through apocenter completes the other 80%. Polar alignment is more likely to occur for disks around eccentric binaries, suggesting the flux curves observed from these disks are likely to be asymmetric along the orbital period.
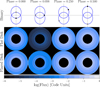 |
Fig. 1 Illumination of the disk at different points of the binary orbit, for an equal mass central binary of e = 0.5. Each column shows the position of the binary stars (top), along with the illuminated flux received by a razor-thin disk (middle) and a flared disk (bottom). For the flared disk model, dashed lines along the disk face indicate the regions where the incoming starlight would be shadowed due to the presence of a puffed inner rim; gray and white dashed lines show shadowed regions for puff heights of 1.5hin and 2.0hin, respectively. Note that, for the second column, the stars are shown with a small vertical displacement to show asymmetric lighting effects close to plane crossing. |
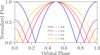 |
Fig. 2 Synthetic light curves showing incoming flux to a polar-aligned disk as a function of binary orbital phase, plotted for various binary eccentricities. All curves have been normalized to their peak brightness value, which occurs at binary apocenter. |
2.2 Disk flaring
A more realistic depiction of the disk geometry includes the finite disk thickness and flared disk geometry. A flared disk geometry gives all parts of the disk a direct line of sight to the center of the system, reducing the amount of self-shadowing. Additionally, the surface normal n̂ is angled inward towards the center, increasing the amount of illumination received from the central stars. The amount of flaring in a disk is typically characterized by a flaring index β, where the disk scale height h/r ∝ rβ. A positive value for β indicates disk flaring, while β = 0 represents a disk with a constant scale height (no flaring).
To include flaring geometry in our analytic calculations, we parameterized the disk height using an initial disk scale height h0 and a flaring index β, and set the vertical height of the disk as h(r) = h0(r/r0)β+1. We also considered the changing angle of the disk surface, which is angled to the vertical axis by an amount dh(r)/dr = (β + 1)h/r(r). The third row of Figure 1 shows the illumination profile for a disk with a scale height of h0 = 0.05, r0 = a, and flaring index β = 0.25, a structure similar to passively illuminated disks (Chiang & Goldreich 1997). Flaring disks have a similar flux pattern as a flat disk, but receive slightly more flux overall, causing a shallower falloff in flux farther out in the disk. The flux does not fall to zero during disk plane crossings, as the flaring profile allows all parts of the disk to maintain a direct line of sight to the star.
2.3 Inner rim
The inner edge of a protoplanetary disk is the only portion of the disk that receives direct illumination at all times, even in the single star case when the star remains fixed in the disk plane. The large amount of thermal energy received by this portion of the disk may change the geometry of the inner portions of the disk. In some models, this region is thought to “puff up” and form an inner rim at the edge of the disk, increasing the vertical scale height and potentially casting a shadow on large portions of the outer disk (Isella & Natta 2005; Dong 2015).
In a polar disk scenario, the inner rim still receives a large amount of stellar radiation, potentially leading to a puffed up inner rim. The effect on the disk illumination is small when the stars are at apocenter, since light is coming from high above the disk, but the presence of an inner rim may be more important for intercepting starlight during binary pericenter and disk plane crossings, when the vertical displacement of the stars is low.
To investigate these effects, we modeled an inner puff in a similar fashion to the artificial rim used in Dong (2015), as a solid wall that blocks all incoming light. We added an inner rim to our flared disk model with heights hpuff = 1.5hin and 2.0hin, where hin is the nominal height of the inner edge of the disk following the standard power-law profile. When calculating the flux onto the disk, we checked the vertical height of the rays as they cross the inner rim; incoming light rays with a vertical height less than the rim height hpuff were removed. As stated in Dong (2015), this treatment is artificial and overestimates the effect of the rim on the illumination of the disk. A more realistic rim will intercept only a portion of the stellar flux and instead cast a partial shadow on the outer disk. We consider this model to represent the upper limit for the effect of shadowing from an inner rim.
In Figure 1, the dashed lines in the third row highlight the regions of the disk which would be shadowed by a heightened inner rim. The gray and white contours correspond to puff heights of hpuff = 1.5hin and 2.0hin, respectively. The effect is negligible when the stars are far from the disk plane, but large shadows are cast at times close to disk plane crossing; for hpuff = 2.0hin, the shadow covers nearly the entire disk. Including the effects of shadowing is important in determining an accurate amount of flux during disk crossing, since both stars are in the disk plane and will be partially shadowed.
In order to highlight the effects of the different geometric models considered in this section, we plot the flux curves for each model in Figure 3. The flux curves were created using a disk similar to HD 98800B (rin = 2a, rout = 5a), but using a central binary of e = 0.5 to highlight the effect of the binary orbit. We used an initial scale height of (h/r)0 = 0.05 at r = a. For the flaring and puffed disk models, we applied a flaring index of β = 0.25, and increased the scale height of the inner edge of the disk to hpuff = 2.0hin for the puffed disk model. Flared disks intercept more light than the razor-thin approximation, as the disk surface is more directly illuminated by the starlight. For the puffed disk model, the disk receives less light overall and has a more pronounced minimum during binary pericenter, with the incoming flux dropping to zero for an extended period of time during plane crossings. If the inner rim is high enough, it is possible for the flux to drop to zero completely for the entirety of binary pericenter, removing the secondary peak entirely. This suggests that the stellar flux is intercepted entirely by the inner rim during the pericenter passage. However, each model is quite similar, and may be difficult to differentiate when comparing with observations.
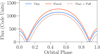 |
Fig. 3 Effect of different disk models on the phase light curve for a disk around an e = 0.5 central binary. Unlike Figure 2, values have not been normalized in order to highlight the differences in brightness between the models. Flared disks appear slightly brighter than the razor-thin disk, while puffed disks show a longer minimum during binary pericenter. |
3 Radiative transfer modeling
In the previous numerical analysis, there are several additional effects, which we do not consider for the sake of simplicity in our calculations. The combination of finite star size and disk thickness, positioning of the second star during pericenter, and scattering within the disk create a complex series of self-shadowing and secondary lighting effects along multiple different regions of the disk, the sum of which is difficult to calculate via analytic methods. To try and capture all of these behaviors simultaneously, we turn to the use of a Monte Carlo radiative transfer code which can use modeling to capture the total behavior of these effects.
We performed radiative transfer modeling using the software RADMC3d (Dullemond et al. 2012). We modified the default ppdisk setup to generate a polar-aligned protoplane-tary disk. The simulation grid consists of a 64 × 128 × 256 grid in spherical-polar coordinates (r, θ, φ). The simulation domain covers [2au, 10au] in r, [0, π] in θ, and [0,2π] in φ, with cells logarithmically spaced in r and linearly spaced in θ and φ.
The setup of our disk is made to mimic the circumbinary disk of HD 98800b. We set the inner and outer radii of the disk at 2.5 and 5 au, respectively, and considered two cases where the initial scale height of the disk is set to (h/r)0 = 0.01 and 0.05 at r = rin. We initialized the disk in the xy-plane of the simulation domain, following a surface density power-law profile of Σ ∝ r−1. For the dust profile, we used a dust grain distribution between 0.1 μm and 10.0 mm with a power-law exponent of −3.5, adopted a dust-togas mass ratio of 1 × 10⁻² solar masses, and assumed the dust is perfectly mixed with the gas. Note that by assuming perfect mixing of the dust, the dust and gas scale heights are identical. For the dust opacities, we used the DSHARP opacities from Birnstiel et al. (2018). We ignored contributions from ice grains, as the relatively compact size of the disk keeps it within the ice line.
The central binary of HD 98800B is highly eccentric (e = 0.8), with an orbital separation of 1 au. We treated the stars as two central light sources which move with time. For the two components (Ba and Bb), we used stellar masses of MBa = 0.77 M⊙, MBb = 0.58 M⊙, stellar radii of RBa = 1.09 R⊙, RBb = 0.85 R⊙, and stellar temperatures of TBa = 4200 K, TBb = 4000K (Boden et al. 2005; Zúñiga-Fernández et al. 2021). We analytically calculated the orbits of the stars by solving Kepler’s equation, generating 100 positions for each star equally spaced in time.
Similar to Section 2, we considered three disk models in our radiative transfer simulations. Our first model consisted of a nonflaring disk, with β = 0 and a constant scale height throughout. The second model considered a flaring disk with β = 1/4. Our third model added a puffed inner rim to the flared disk model, created by doubling the initial scale height in the range of r = 2 au to 3 au.
We generated synthetic images of the disk using RADMC3d across a full orbit of the binary in two steps, first by calculating the thermal structure of the disk with the given stellar positions, then ray tracing the image at a given wavelength. This process creates images under the assumption that the gas and dust density field is static with time, and that the emission from the disk responds instantly to the changing radiation field. Images were created at three different wavelengths: 1.65 μm (H-band), 0.8 mm (ALMA Band 7), and 1.3 mm (ALMA Band 6). These wavelengths correspond to images taken at scattered light and millimeter/sub-millimeter wavelengths, and are similar to the observational data of HD 98800B taken in the past (see Appendix A). We used 107 photon packages to generate our synthetic images, with scattering of photons treated anisotropically using the Henyey-Greenstein function (Henyey & Greenstein 1941). We also utilized the modified random walk method (MRW, Fleck & Canfield 1984) for photon transport to reduce computation time in optically thick regions.
4 Results
Our radiative transfer simulations exhibit brightness changes across multiple wavelengths during the binary orbital period, in agreement with our numerical analysis in Section 2. In Figure 4, we show the results of our radiative transfer simulations for a flared disk model. Each row plots the flux density Fλ of the disk at a particular wavelength, while each column shows the appearance of the disk when the binary is at different orbital phases (pericenter, disk plane crossing, mid-orbit, and apocenter). The synthetic images show many similarities to the images produced in Figure 1, showing considerable dimming of the disk face as the stars approach pericenter. The secondary brightness peak at pericenter is not as visible in the radiative transfer images. A small amount of azimuthal asymmetry is visible in the H-band images at mid-orbit (third row), when the stellar components are both horizontally and vertically offset from the center of the system.
Figure 5 shows how our radiative transfer simulations are modified by different disk geometries for an inner disk scale height of h/r = 0.01. We plot synthetic light curves at both H-band and ALMA Band 7, showing our disk models with no flaring, flaring, and a flared disk with an inner puff. In the top panel we show the normalized flux density relative to the peak at binary apocenter, while in the bottom panel we show the absolute flux density assuming the disk is viewed face-on at the distance of HD 98800B (d = 45 pc). In gray we plot the analytic thermal flux from a razor-thin disk with an e = 0.8 central binary, using the incident flux curve generated from Figure 2. Assuming the disk is optically thick, the disk should radiate as a blackbody, with the temperature of each part determined by the local radiation field. Combined with our assumption of thermal equilibrium with the stellar radiation field, this temperature corresponds to the incident stellar flux on the disk through the Stefan-Boltzmann law, Fin ∝ σT1/4.
All three disk models create light curves which are similar to the razor-thin model, with the puffed disk model predicting a slightly lower relative flux density due to self-shadowing effects. The largest difference in the various models appears during pericenter, where the dimming of the disk is strongly determined by the disk geometry. Flaring disks capture more of the stellar flux and exhibit a low amount of variability, dimming by less than a factor of two, while the flat and puffed models exhibit strong self-shadowing effects, dropping to nearly four times their peak brightness at apocenter. The pronounced minima in these models also allow for the secondary peak at pericenter to be observed. For a thicker disk (Figure 6), the variability is significantly reduced for all models, with the disk dimming to only 80-90% of its maximum brightness during plane crossings. When comparing the absolute flux density from the models, it is notable that the light curves brighten considerably as the disk scale height decreases. Our models show differing levels of brightening, with the non-flaring disk becoming brighter than the flaring model at small h/r. We attribute this effect to the changing illumination angle. In a standard model of a flaring disk (i.e., Chiang & Goldreich 1997), stellar photons strike the disk at a shallow, “grazing” angle. This shallow angle allows the photons to penetrate a significant distance into the disk before being scattered, transferring energy deeper into the lower layers. When the star is at apocenter, its vertical displacement can be greater than the vertical height of the disk, and stellar photons shine more directly down into the surface. Photons emitted here will encounter high-density material faster and are absorbed higher up in the disk, keeping the midplane at a cooler temperature and reducing the millimeter flux density. This can also explain why the flared model is brighter than the non-flared model during binary pericenter; it is only when the binary is far above the disk that the assumption of a grazing angle breaks down.
In Figure 7, we compare the appearance of the disk at binary pericenter and apocenter by examining the synthetic images in H-band emission (left panel) as well as the SED of the system (right panel). For this figure, we rotate the disk to match the orientation of HD 98800B as it appears on the sky (i = 154°, PA = 16°). In addition to the overall brightness increase, the scattered light images show more even illumination when the stars are farther out of the disk plane. The observed changes are due to the vertical motion of the stars changing the scattering phase angle. Near binary pericenter, the incoming starlight impacts the disk at shallow angles, emphasizing forward scattering and brightening the near side of the disk, as seen in many scattered light images of circumstellar disks (McCabe et al. 2002; Benisty et al. 2023). Close to the apocenter, the large vertical height of the star increases the scattering angle on the near side of the disk, reducing the amount of forward scattering and causing the disk to appear closer to a smooth ring. During binary apocenter, the peak of the SED, which sits at roughly 20 μm, brightens by over a factor of two, with similar increases in flux density present out into the millimeter wavelengths.
Our radiative transfer models suggest variability for both the HD 98800 system and other sources with polar-aligned disks, observable at multiple different wavelengths. The geometry of the disk can modify the amount of variation seen in the disk over the binary orbital period. If the thermal response of the disk is fast, the variability may be visible at millimeter wavelengths. In addition, smaller effects involving azimuthal asymmetries in scattered light may also be present.
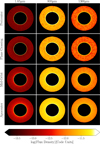 |
Fig. 4 Synthetic radiative transfer images created from RADMC-3D. Each column shows the disk at a particular observing wavelength, while each row shows the disk at a particular point in the binary orbit. From top to bottom, the images are shown at: binary pericenter, during disk plane crossing, mid-orbit, the point of greatest horizontal displacement of the binary, and binary apocenter. From left to right, observing wavelengths are 1.65 μm (H-band), 800 μm, and 1.3 mm (ALMA Band 7). |
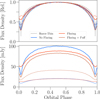 |
Fig. 5 Comparison of 1.3 mm and H-band light curves created from the RADMC-3D radiative transfer models, with a disk scale height of h/r = 0.01. In the top panel, curves normalized to their peak brightness at apocenter to emphasize the amount of variability. In the top panel, we also show the numerical flux calculated from the razor-thin disk model (Fig. 2), with an exponent of 1/4 to represent disk temperature and thermal emission at millimeter wavelengths. In the bottom panel, we plot the absolute flux density assuming the disk is viewed face-on at a distance of d = 45 pc, the distance of HD 98800B. Solid and dashed curves indicate observations at λ = 1.3 mm and 1.65 μm (H-band), respectively. |
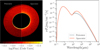 |
Fig. 7 Comparison of a disk similar to HD 98800B in H-band emission at the binary pericenter and apocenter. In this figure, the disk is flaring, with a scale height of h/r = 0.01, and has been rotated to match the on-sky appearance of the HD 98800B. The left panel shows the emission across the surface of the disk (left: pericenter; right: apocenter), while the right panel shows the SED of the system (gray: pericenter; orange: apocenter). |
5 Discussion
5.1 Using variable illumination to probe inclined disks
Flux variability caused by the motion of the central stars out of the disk plane is most noticeable when considering polar-aligned disks, but it is also likely to occur in all disks with a central binary. Even though we focus on HD 98800B in this paper, where the binary and disk planes are perpendicular, it may be possible to detect similar illumination patterns in other disks with a smaller mutual inclination to their central binaries. A handful of well-resolved disks have been measured with a significant mutual inclination θmut between the disk and (outer) binary planes, including the GW Orionis circumtriple disk (θmut = 28.8°, Rabago et al. 2024), the circumbinary disk of HD 142527 (θmut = 50°, Nowak et al. 2024), and the circumtriple disk of GG Tau A (θmut ~ 30°, Toci et al. 2024). In circumtriple systems, polar alignment is much more difficult to maintain and is only expected to be stable in a close-in radial region around three to ten times the separation of the outer binary (Ceppi et al. 2023; Lepp et al. 2023). Observations of other circumbinary disks may reveal this phenomenon, and may even help confirm the misaligned nature of the disks themselves. A degeneracy in the longitude of the ascending node as measured on the sky plane commonly leads to two differing values for θmut, and examining the varying illumination on the disk surface may help constrain the true misalignment angle. Observations taken close to disk plane crossing may provide constraints on the disk scale height and cooling time.
We note that the images and light curves from our radiative transfer analysis (Section 3) are created under the assumption that the thermal temperature of the disk at a particular moment corresponds to the radiation field of the stars at their current position, and that the density profile of the disk does not change during the binary orbit. In other words, our models assume a disk with a quickly changing thermal structure but a slowly evolving density structure, providing a simplified scattering surface and thermal profile which can be easily examined. Although a detailed calculation of the disk’s density and thermal structure requires treatment of coupled, time-dependent radiation and hydrodynamic effects, we discuss the limitations of our models below.
For scattered light observations, the assumption of an instantaneous response from the disk may be reasonable as the observed image is just the light scattered off of the disk surface. For observations at millimeter wavelengths, this assumption may be considered the limit of fast cooling rates in the disk. If the rate of thermal cooling in the disk tcool is comparable to the binary orbital period tb, then the temperature of the disk may relax considerably during pericenter passage, and the observed flux density at millimeter wavelengths may vary as in Figure 5; on the other hand, slower cooling rates are more likely to keep the disk close to a steady temperature state and show less variability at millimeter wavelengths. Figures 5 and 6 suggest that the amplitude of the flux density at millimeter wavelengths is highly dependent on the dust scale height, with (h/r)d ≲ 0.05 required for amplitudes of around 10 percent. Small dust scale heights in protoplanetary disks may be achievable with vertical dust settling, with theoretical works (Youdin & Lithwick 2007; Yang & Zhu 2021; Baronett et al. 2024) and recent observations (Isella et al. 2016; Doi & Kataoka 2021; Villenave et al. 2022) suggesting hdust ~ 0.1 hgas in the dust rings of some disks (h/rgas ≈ 0.05-0.1).
Analytic estimates of tcool suggest fast cooling may occur in the inner regions of the disk. We estimated the cooling timescale of the disk by comparing the heat content of the disk and its luminosity (e.g., Kratter & Lodato 2016):
 (3)
(3)
Here, Σ is the surface density of the disk, cs is the local sound speed, Teff is the local effective temperature (which is equivalent to the surface temperature if the disk is optically thick), σ is the Stefan-Boltzmann constant, and γ is the adiabatic index. This equation relates the total thermal energy of the disk and the energy outflow rate lost via radiation. In the case of disk heating, which may happen as the stars rise out of the disk plane, there is instead a net energy influx, and we can replace the Stefan-Boltzmann component of the denominator with the incoming stellar flux, L*/4πr2.
In Figure 8, we plot the cooling and heating timescales for the disks used in the RADMC3d models, using the disk surface density and temperature from the RADMC3d radiative transfer calculation. We note that this calculation is not entirely self-consistent, since the construction of the RADMC3d models assumes equilibrium with the instantaneous stellar radiation field. With these models, we find a cooling time of about 1 year at r = 2.5 au and 3 years at r = 5 au, very close to the orbital period of HD 98800B. Although this is a rough calculation, it suggests that the thermal timescales of the disk may be comparable to the binary orbital period in the inner regions of the disk, producing visible changes in the thermal flux. We also note that opacity may play an important role in determining which regions of the disk are susceptible to thermal variation; a similar formulation of tcool by Zhang & Zhu (2020) includes effects for optically thick and thin limits, and predicts longer cooling times than the single opacity regimes at all radii. If the emission is expected to be optically thick, which may be the case if the dust is settled into the disk midplane, then the optical depth is τ = Σκ∕2, leading to shorter cooling timescales in the outer disk as the optical depth decreases and longer timescales in the inner disk as radiation is trapped at high optical depths.
Since these estimates predict tcool and tb can be comparable, the inner disk may only partially cool during the binary orbit. Thus, the variations in flux shown in Figures 5 and 6, which assume instantaneous cooling, should be interpreted as an upper limit and that the actual observed fluctuations may be smaller. The close competition between these two timescales strongly motivates the need for direct observations and long-term monitoring of misaligned disks to see if changes in the thermal flux of the disk are in fact visible and to better constrain the relevant cooling timescales.
The density profile of our disk models is assumed to be roughly static, as density fluctuations are expected to occur on the local orbital timescale torb = h∕cs, which is longer than the binary orbital period tb = Ωb−1. However, variations of the proto-planetary disk temperature with time have recently been studied as a potential avenue for producing substructures in the outer disk. Previous simulations have usually considered this effect in the context of shadowed lanes created by a misaligned inner disk (Montesinos et al. 2016; Montesinos & Cuello 2018; Zhang & Zhu 2024; Ziampras et al. 2025; Zhu et al. 2025), where material orbiting in and out of the shadow experiences sudden changes in temperature. These shadowed lanes generate an asymmetric pressure gradient in the azimuthal direction, leading to the generation of spiral arms and vortices. For a misaligned circumbinary disk, the motion of the central binary in and out of the disk plane may produce a similar effect, changing the irradiation flux across the entire disk. In this case, the disk temperature may change globally instead of at a particular azimuthal location, but this effect may still have the potential to generate substructures.
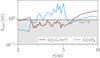 |
Fig. 8 Cooling timescale as measured from our radiative transfer models. The blue and red curves represent timescales for radiative cooling and stellar heating, respectively. The gray-shaded region represents timescales which are shorter than the binary orbital period tb. Note that the disk in our RADMC3d models has a radial extent of 2.5-5 au. |
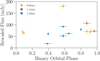 |
Fig. 9 Archival observations of HD 98800B, with flux density rescaled using a spectral power-law index of α = 2. |
5.2 Observations of HD 98800
The HD 98800 system, and later HD 98800B, has long been known as a source presenting strong infrared excess, with observations dating back over 35 years (Walker & Wolstencroft 1988). Observations of the system have been conducted across a large range of wavelengths, from optical (Soderblom et al. 1998) to far-infrared (Ribas et al. 2018). The system is known to be variable (Soderblom et al. 1998), though it is not clear if the variability is related to the binary orbital period.
Past observations of the HD98800B system were taken at various points in time and thus may show variations in flux that are correlated with the orbital period. To examine this idea, we searched archival data for prior observations of HD 98800B at 0.8, 1.1, and 1.3mm wavelengths (for a full list of the observations considered here, see Appendix A). The date of observation, combined with an orbital solution of the BaBb binary, gives an orbital phase for each observation. Assuming the flux density Fλ at millimeter-wavelengths is optically thick, we rescaled the observed Fλ using a spectral index α using
 (4)
(4)
where Fλ,obs is the flux density measured in the observation, λ is the observing wavelength and α is the spectral index, which we choose as 2. Previous modeling of the HD 98800B disk finds that α = 2 provides a good fit to the observed data out to centimeter wavelengths (Ribas et al. 2018), suggesting emission that is optically thick or originating from large dust grains. We plot the rescaled flux density versus orbital period in Figure 9. There is a large amount of scatter in the observations, and for the wavelength bands we consider there is not a clear trend of decreasing flux as the binary approaches pericenter. However, the observations used to create Figure 9 are a collection of observations using multiple different instruments across several years and different observing epochs, using different calibration techniques. The mixture of different observing methods makes a proper comparison of the fluxes in this dataset fairly challenging.
Future observations and long-term monitoring of the HD 98800B system across different orbital phases can provide increased insight into the illumination variability of the disk, as well as the response of the disk during the binary orbital period. Improved coverage across the binary orbit, as well as better calibration and flux measurements from current instruments, will help constrain the intrinsic variability of the system. The relatively short binary orbital period, tb ~ 1 yr, makes the HD 98800B system an easily accessible target for time monitoring. Though scattered light observations are difficult due to the small size of the disk (Rich et al. 2022; Cuello et al. 2025), future observatories such as ELT may be able to resolve the disk and determine if any asymmetries are present. For reference, Table 1 lists the dates of future pericenter passages of the BaBb binary, as calculated from the two orbital solutions given in Zúñiga-Fernández et al. (2021) and Merle et al. (2024).
From the orbital solution calculated in Zúñiga-Fernández et al. (2021), the A binary of the HD 98800 system is expected to pass behind the circumbinary disk some time in the near future, with more recent modeling of the disk by Faruqi et al. (2025) suggesting the occultation event may have already begun. This occultation event is expected to last several years, into the 2030s. In combination with the analysis presented above, the HD 98800B disk is positioned as a target of particular interest for determining several fundamental disk properties. Optical/NIR monitoring of the system in the coming years will provide a wealth of information into the structure of HD 98800B, and how the surrounding binary stars influence its evolution. As described in Faruqi et al. (2025), observations of how the A binary disappears behind the disk and reappears within the cavity can provide constraints on the optical thickness of the disk material, and may give hints into the presence of any perturbation-induced substructures. Simultaneously, observing changes in the disk flux due to the B binary can provide constraints on the cooling rate of the disk material and the vertical structure of the disk.
Recent and upcoming pericenter passages of the HD 98800B binary, using two different orbital solutions.
6 Conclusions
Polar-aligned circumbinary disks are systems where the disk and central binary stars inhabit highly misaligned orbits. This unique geometrical configuration allows the stars to rise vertically above and below the disk plane, potentially causing large amounts of variability in the disk illumination and temperature structure. We show this variability is directly correlated with the motion of the binary using both numerical analysis and radiative transfer modeling, and produces a periodically varying light curve that peaks twice at binary apocenter and pericenter. The geometry of the disk strongly affects the amount of stellar flux received by the face of the disk, which can modify the amount of variation in the observed light curve and change the length of the minimum at pericenter. In scattered light observations, additional observational effects may be visible due to changes in the scattering angle as the stars move vertically, rendering the scattered light more asymmetric at pericenter.
Our radiative transfer simulations suggest the presence of many potential observable signatures which may be identified through long-term monitoring of misaligned disks. Observing inclined disks at multiple epochs may reveal new insight into the geometry and internal structure of the disk, deepening our understanding of how the disks operate in other systems. Flux variability at millimeter wavelengths can reveal the cooling rate of the disk during the binary orbit, providing insight into the internal thermal structure of the disk. The circumbinary disk around HD 98800B is of particular interest, due to the presence of a nearly polar disk around a highly eccentric binary; the unique configuration of the disk may allow future observations of this system to constrain multiple disk parameters at the same time.
Acknowledgements
We thank the anonymous referee for their suggestions which have improved the overall quality of the manuscript. I.R. thanks Rebecca Nealon for helpful discussions. I.R. is funded by PRIN-MUR 20228JPA3A and by the European Union Next Generation EU, CUP: G53D23000870006. Views and opinions expressed are however those of the author(s) only and do not necessarily reflect those of the European Union or the European Research Council. Neither the European Union nor the granting authority can be held responsible for them.
References
- Aly, H., Dehnen, W., Nixon, C., & King, A. 2015, MNRAS, 449, 65 [NASA ADS] [CrossRef] [Google Scholar]
- Avenhaus, H., Quanz, S. P., Schmid, H. M., et al. 2014, ApJ, 781, 87 [Google Scholar]
- Avenhaus, H., Quanz, S. P., Schmid, H. M., et al. 2017, AJ, 154, 33 [Google Scholar]
- Baronett, S. A., Yang, C.-C., & Zhu, Z. 2024, MNRAS, 529, 275 [NASA ADS] [CrossRef] [Google Scholar]
- Benisty, M., Dominik, C., Follette, K., et al. 2023, in Astronomical Society of the Pacific Conference Series, 534, Protostars and Planets VII, eds. S. Inutsuka, Y. Aikawa, T. Muto, K. Tomida, & M. Tamura, 605 [Google Scholar]
- Birnstiel, T., Dullemond, C. P., Zhu, Z., et al. 2018, ApJ, 869, L45 [CrossRef] [Google Scholar]
- Boden, A. F., Sargent, A. I., Akeson, R. L., et al. 2005, ApJ, 635, 442 [NASA ADS] [CrossRef] [Google Scholar]
- Ceppi, S., Longarini, C., Lodato, G., Cuello, N., & Lubow, S. H. 2023, MNRAS, 520, 5817 [NASA ADS] [CrossRef] [Google Scholar]
- Chiang, E. I., & Goldreich, P. 1997, ApJ, 490, 368 [Google Scholar]
- Cuello, N., Alaguero, A., & Poblete, P. P. 2025, Symmetry, 17, 344 [Google Scholar]
- Czekala, I., Chiang, E., Andrews, S. M., et al. 2019, ApJ, 883, 22 [NASA ADS] [CrossRef] [Google Scholar]
- Di Folco, E., Dutrey, A., Le Bouquin, J. B., et al. 2014, A&A, 565, L2 [NASA ADS] [CrossRef] [EDP Sciences] [Google Scholar]
- Doi, K., & Kataoka, A. 2021, ApJ, 912, 164 [NASA ADS] [CrossRef] [Google Scholar]
- Dong, R. 2015, ApJ, 810, 6 [NASA ADS] [CrossRef] [Google Scholar]
- Dullemond, C. P., Juhasz, A., Pohl, A., et al. 2012, RADMC-3D: A multipurpose radiative transfer tool, Astrophysics Source Code Library [record ascl:1202.015] [Google Scholar]
- Farago, F., & Laskar, J. 2010, MNRAS, 401, 1189 [Google Scholar]
- Faruqi, A., Kennedy, G., Nealon, R., & Rowther, S. 2025, MNRAS, 537, 2516 [Google Scholar]
- Fleck, Jr., J. A., & Canfield, E. H. 1984, J. Computat. Phys., 54, 508 [Google Scholar]
- Franchini, A., Lubow, S. H., & Martin, R. G. 2019, ApJ, 880, L18 [Google Scholar]
- Henyey, L. G., & Greenstein, J. L. 1941, ApJ, 93, 70 [Google Scholar]
- Hu, Z., Zhu, W., Dai, F., et al. 2024, ApJ, 977, L28 [Google Scholar]
- Isella, A., & Natta, A. 2005, A&A, 438, 899 [NASA ADS] [CrossRef] [EDP Sciences] [Google Scholar]
- Isella, A., Guidi, G., Testi, L., et al. 2016, Phys. Rev. Lett., 117, 251101 [NASA ADS] [CrossRef] [Google Scholar]
- Jensen, E. L. N., Mathieu, R. D., & Fuller, G. A. 1996, ApJ, 458, 312 [Google Scholar]
- Kennedy, G. M., Wyatt, M. C., Sibthorpe, B., et al. 2012, MNRAS, 421, 2264 [Google Scholar]
- Kennedy, G. M., Matrà, L., Facchini, S., et al. 2019, Nat. Astron., 3, 230 [Google Scholar]
- Kenworthy, M. A., González Picos, D., Elizondo, E., et al. 2022, A&A, 666, A61 [NASA ADS] [CrossRef] [EDP Sciences] [Google Scholar]
- Keppler, M., Penzlin, A., Benisty, M., et al. 2020, A&A, 639, A62 [NASA ADS] [CrossRef] [EDP Sciences] [Google Scholar]
- Kratter, K., & Lodato, G. 2016, ARA&A, 54, 271 [NASA ADS] [CrossRef] [Google Scholar]
- Kraus, S., Kreplin, A., Young, A. K., et al. 2020, Science, 369, 1233 [NASA ADS] [CrossRef] [Google Scholar]
- Lepp, S., Martin, R. G., & Lubow, S. H. 2023, ApJ, 943, L4 [NASA ADS] [CrossRef] [Google Scholar]
- Martin, R. G., & Lubow, S. H. 2017, ApJ, 835, L28 [NASA ADS] [CrossRef] [Google Scholar]
- Martin, R. G., & Lubow, S. H. 2018, MNRAS, 479, 1297 [NASA ADS] [CrossRef] [Google Scholar]
- McCabe, C., Duchêne, G., & Ghez, A. M. 2002, ApJ, 575, 974 [NASA ADS] [CrossRef] [Google Scholar]
- Merle, T., Pourbaix, D., Jorissen, A., et al. 2024, A&A, 684, A74 [NASA ADS] [CrossRef] [EDP Sciences] [Google Scholar]
- Miranda, R., & Lai, D. 2015, MNRAS, 452, 2396 [Google Scholar]
- Montesinos, M., & Cuello, N. 2018, MNRAS, 475, L35 [NASA ADS] [CrossRef] [Google Scholar]
- Montesinos, M., Perez, S., Casassus, S., et al. 2016, ApJ, 823, L8 [Google Scholar]
- Nowak, M., Rowther, S., Lacour, S., et al. 2024, A&A, 683, A6 [NASA ADS] [CrossRef] [EDP Sciences] [Google Scholar]
- Rabago, I., Zhu, Z., Lubow, S., & Martin, R. G. 2024, MNRAS, 533, 360 [NASA ADS] [CrossRef] [Google Scholar]
- Rabago, I., Zhu, Z., Martin, R. G., & Lubow, S. H. 2023, MNRAS, 520, 2138 [NASA ADS] [CrossRef] [Google Scholar]
- Ribas, Á., Macías, E., Espaillat, C. C., & Duchêne, G. 2018, ApJ, 865, 77 [NASA ADS] [CrossRef] [Google Scholar]
- Rich, E. A., Monnier, J. D., Aarnio, A., et al. 2022, AJ, 164, 109 [NASA ADS] [CrossRef] [Google Scholar]
- Rucinski, S. 1993, IAU Circ., 5788, 2 [Google Scholar]
- Soderblom, D. R., King, J. R., Siess, L., et al. 1998, ApJ, 498, 385 [NASA ADS] [CrossRef] [Google Scholar]
- Stern, S. A., Weintraub, D. A., & Festou, M. C. 1994, IAU Circ., 6003, 3 [NASA ADS] [Google Scholar]
- Sylvester, R. J., Barlow, M. J., & Skinner, C. J. 1994, Ap&SS, 212, 261 [Google Scholar]
- Sylvester, R. J., Skinner, C. J., Barlow, M. J., & Mannings, V. 1996, MNRAS, 279, 915 [Google Scholar]
- Toci, C., Ceppi, S., Cuello, N., et al. 2024, A&A, 688, A102 [NASA ADS] [CrossRef] [EDP Sciences] [Google Scholar]
- Verrier, P. E., & Evans, N. W. 2009, MNRAS, 394, 1721 [NASA ADS] [CrossRef] [Google Scholar]
- Villenave, M., Stapelfeldt, K. R., Duchêne, G., et al. 2022, ApJ, 930, 11 [NASA ADS] [CrossRef] [Google Scholar]
- Walker, H. J., & Wolstencroft, R. D. 1988, PASP, 100, 1509 [NASA ADS] [CrossRef] [Google Scholar]
- Walker, H. J., & Butner, H. M. 1995, Ap&SS, 224, 389 [Google Scholar]
- Yang, C.-C., & Zhu, Z. 2021, MNRAS, 508, 5538 [NASA ADS] [CrossRef] [Google Scholar]
- Youdin, A. N., & Lithwick, Y. 2007, Icarus, 192, 588 [NASA ADS] [CrossRef] [Google Scholar]
- Zhang, S., & Zhu, Z. 2020, MNRAS, 493, 2287 [NASA ADS] [CrossRef] [Google Scholar]
- Zhang, S., & Zhu, Z. 2024, ApJ, 974, L38 [Google Scholar]
- Zhu, Z., Zhang, S., & Johnson, T. M. 2025, ApJ, 980, 259 [Google Scholar]
- Ziampras, A., Dullemond, C. P., Birnstiel, T., Benisty, M., & Nelson, R. P. 2025, MNRAS, 540, 1185 [Google Scholar]
- Zúñiga-Fernández, S., Olofsson, J., Bayo, A., et al. 2021, A&A, 655, A15 [NASA ADS] [CrossRef] [EDP Sciences] [Google Scholar]
Note that the orbital solution from Merle et al. (2024) uses a slightly later starting epoch and a longer derived orbital period. The cumulative effect of these differences is that the two solutions differ in the binary orbital phase by approximately 20 days, with the difference increasing by roughly half a day each year. Using either orbital solution does not change the overall results.
Appendix A Past observations of HD 98800B
In Table A.1 we list the references for specific observations, including the observation date(s), wavelength band, total flux observed from the system, as well as the orbital phase derived using the orbital solution from Zúñiga-Fernández et al. (2021)1. For cases where the observation of the system is spread across multiple consecutive days, we use the midpoint of the observing campaign as the orbital phase and the beginning and end dates as the relative error bars in Figure 9. In some cases, such as Jensen et al. (1996), observations were listed as a sum of multiple campaigns throughout the year; for these cases, we list separate entries with different orbital phases for each observing session.
Archival observations of the HD 98800B disk. With the exception of Kennedy et al. (2019), all observations listed here are unresolved.
All Tables
Recent and upcoming pericenter passages of the HD 98800B binary, using two different orbital solutions.
Archival observations of the HD 98800B disk. With the exception of Kennedy et al. (2019), all observations listed here are unresolved.
All Figures
|
Fig. 1 Illumination of the disk at different points of the binary orbit, for an equal mass central binary of e = 0.5. Each column shows the position of the binary stars (top), along with the illuminated flux received by a razor-thin disk (middle) and a flared disk (bottom). For the flared disk model, dashed lines along the disk face indicate the regions where the incoming starlight would be shadowed due to the presence of a puffed inner rim; gray and white dashed lines show shadowed regions for puff heights of 1.5hin and 2.0hin, respectively. Note that, for the second column, the stars are shown with a small vertical displacement to show asymmetric lighting effects close to plane crossing. |
| In the text | |
|
Fig. 2 Synthetic light curves showing incoming flux to a polar-aligned disk as a function of binary orbital phase, plotted for various binary eccentricities. All curves have been normalized to their peak brightness value, which occurs at binary apocenter. |
| In the text | |
|
Fig. 3 Effect of different disk models on the phase light curve for a disk around an e = 0.5 central binary. Unlike Figure 2, values have not been normalized in order to highlight the differences in brightness between the models. Flared disks appear slightly brighter than the razor-thin disk, while puffed disks show a longer minimum during binary pericenter. |
| In the text | |
|
Fig. 4 Synthetic radiative transfer images created from RADMC-3D. Each column shows the disk at a particular observing wavelength, while each row shows the disk at a particular point in the binary orbit. From top to bottom, the images are shown at: binary pericenter, during disk plane crossing, mid-orbit, the point of greatest horizontal displacement of the binary, and binary apocenter. From left to right, observing wavelengths are 1.65 μm (H-band), 800 μm, and 1.3 mm (ALMA Band 7). |
| In the text | |
|
Fig. 5 Comparison of 1.3 mm and H-band light curves created from the RADMC-3D radiative transfer models, with a disk scale height of h/r = 0.01. In the top panel, curves normalized to their peak brightness at apocenter to emphasize the amount of variability. In the top panel, we also show the numerical flux calculated from the razor-thin disk model (Fig. 2), with an exponent of 1/4 to represent disk temperature and thermal emission at millimeter wavelengths. In the bottom panel, we plot the absolute flux density assuming the disk is viewed face-on at a distance of d = 45 pc, the distance of HD 98800B. Solid and dashed curves indicate observations at λ = 1.3 mm and 1.65 μm (H-band), respectively. |
| In the text | |
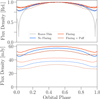 |
Fig. 6 Same as Figure 5, but with h/r = 0.05. |
| In the text | |
|
Fig. 7 Comparison of a disk similar to HD 98800B in H-band emission at the binary pericenter and apocenter. In this figure, the disk is flaring, with a scale height of h/r = 0.01, and has been rotated to match the on-sky appearance of the HD 98800B. The left panel shows the emission across the surface of the disk (left: pericenter; right: apocenter), while the right panel shows the SED of the system (gray: pericenter; orange: apocenter). |
| In the text | |
|
Fig. 8 Cooling timescale as measured from our radiative transfer models. The blue and red curves represent timescales for radiative cooling and stellar heating, respectively. The gray-shaded region represents timescales which are shorter than the binary orbital period tb. Note that the disk in our RADMC3d models has a radial extent of 2.5-5 au. |
| In the text | |
|
Fig. 9 Archival observations of HD 98800B, with flux density rescaled using a spectral power-law index of α = 2. |
| In the text | |
Current usage metrics show cumulative count of Article Views (full-text article views including HTML views, PDF and ePub downloads, according to the available data) and Abstracts Views on Vision4Press platform.
Data correspond to usage on the plateform after 2015. The current usage metrics is available 48-96 hours after online publication and is updated daily on week days.
Initial download of the metrics may take a while.