Fig. 3
Download original image
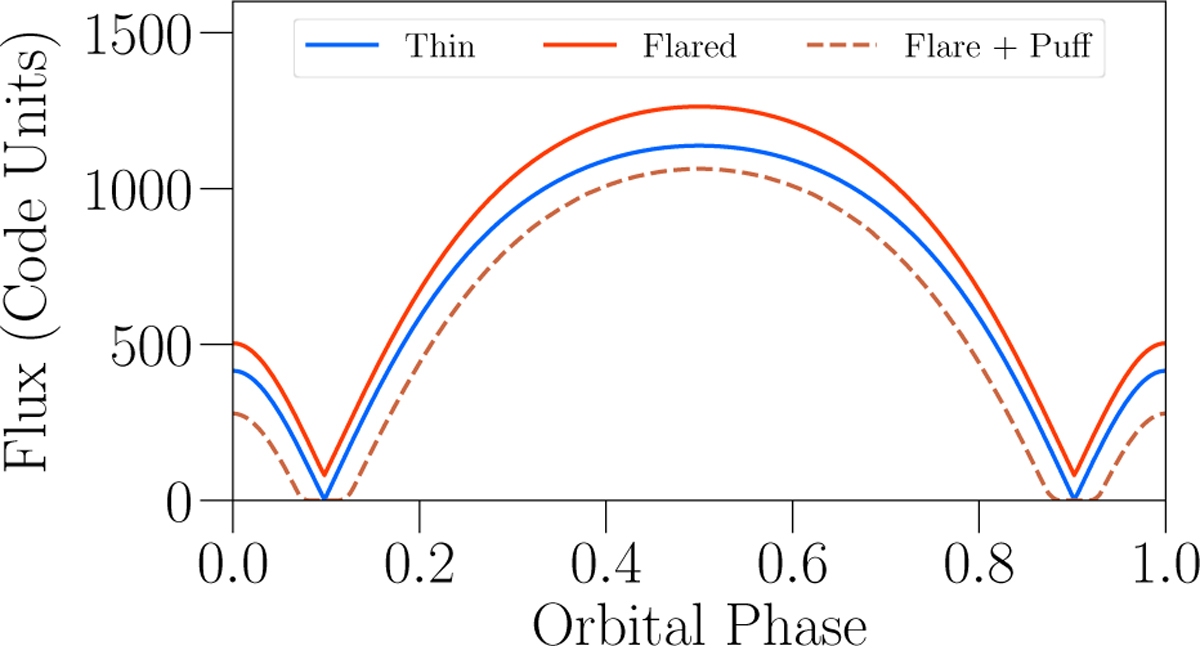
Effect of different disk models on the phase light curve for a disk around an e = 0.5 central binary. Unlike Figure 2, values have not been normalized in order to highlight the differences in brightness between the models. Flared disks appear slightly brighter than the razor-thin disk, while puffed disks show a longer minimum during binary pericenter.
Current usage metrics show cumulative count of Article Views (full-text article views including HTML views, PDF and ePub downloads, according to the available data) and Abstracts Views on Vision4Press platform.
Data correspond to usage on the plateform after 2015. The current usage metrics is available 48-96 hours after online publication and is updated daily on week days.
Initial download of the metrics may take a while.