Fig. 5
Download original image
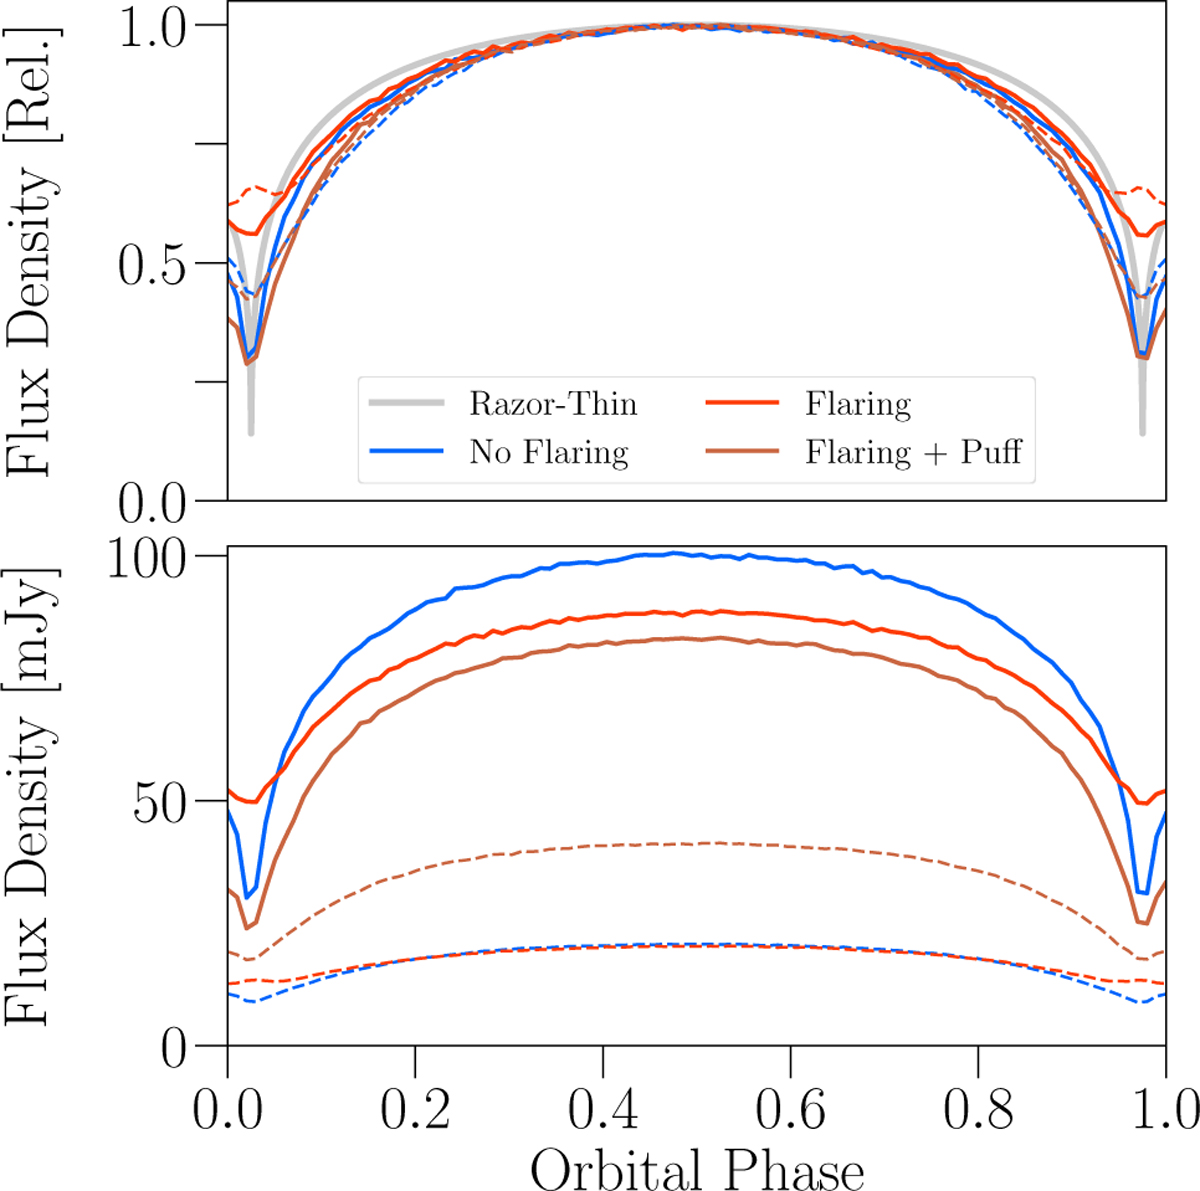
Comparison of 1.3 mm and H-band light curves created from the RADMC-3D radiative transfer models, with a disk scale height of h/r = 0.01. In the top panel, curves normalized to their peak brightness at apocenter to emphasize the amount of variability. In the top panel, we also show the numerical flux calculated from the razor-thin disk model (Fig. 2), with an exponent of 1/4 to represent disk temperature and thermal emission at millimeter wavelengths. In the bottom panel, we plot the absolute flux density assuming the disk is viewed face-on at a distance of d = 45 pc, the distance of HD 98800B. Solid and dashed curves indicate observations at λ = 1.3 mm and 1.65 μm (H-band), respectively.
Current usage metrics show cumulative count of Article Views (full-text article views including HTML views, PDF and ePub downloads, according to the available data) and Abstracts Views on Vision4Press platform.
Data correspond to usage on the plateform after 2015. The current usage metrics is available 48-96 hours after online publication and is updated daily on week days.
Initial download of the metrics may take a while.