Fig. 8
Download original image
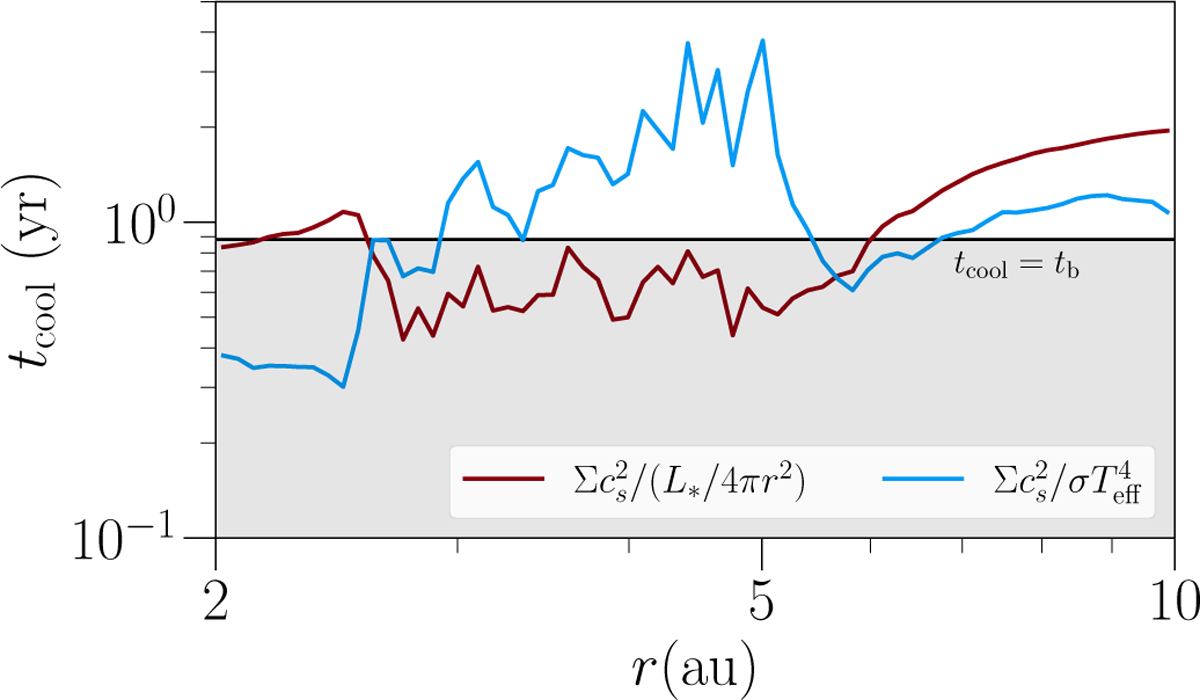
Cooling timescale as measured from our radiative transfer models. The blue and red curves represent timescales for radiative cooling and stellar heating, respectively. The gray-shaded region represents timescales which are shorter than the binary orbital period tb. Note that the disk in our RADMC3d models has a radial extent of 2.5-5 au.
Current usage metrics show cumulative count of Article Views (full-text article views including HTML views, PDF and ePub downloads, according to the available data) and Abstracts Views on Vision4Press platform.
Data correspond to usage on the plateform after 2015. The current usage metrics is available 48-96 hours after online publication and is updated daily on week days.
Initial download of the metrics may take a while.