Open Access
Fig. 1
Download original image
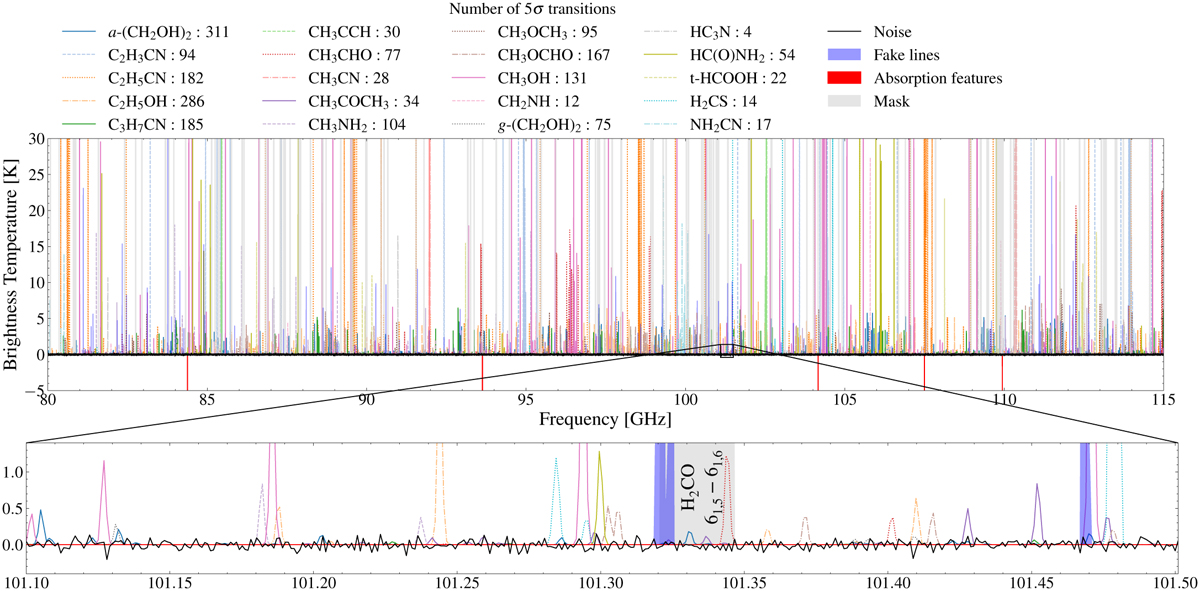
Synthetic spectrum of a classical hot core computed from Table A.5 with a 5 km s−1 line width, a 50 mK Gaussian noise, and a zoom-in on 400 MHz. The LTE models are shown in color. The mask computed with the molecules from Table A.3 is in gray. The fake lines and absorption features are in blue and red, respectively.
Current usage metrics show cumulative count of Article Views (full-text article views including HTML views, PDF and ePub downloads, according to the available data) and Abstracts Views on Vision4Press platform.
Data correspond to usage on the plateform after 2015. The current usage metrics is available 48-96 hours after online publication and is updated daily on week days.
Initial download of the metrics may take a while.