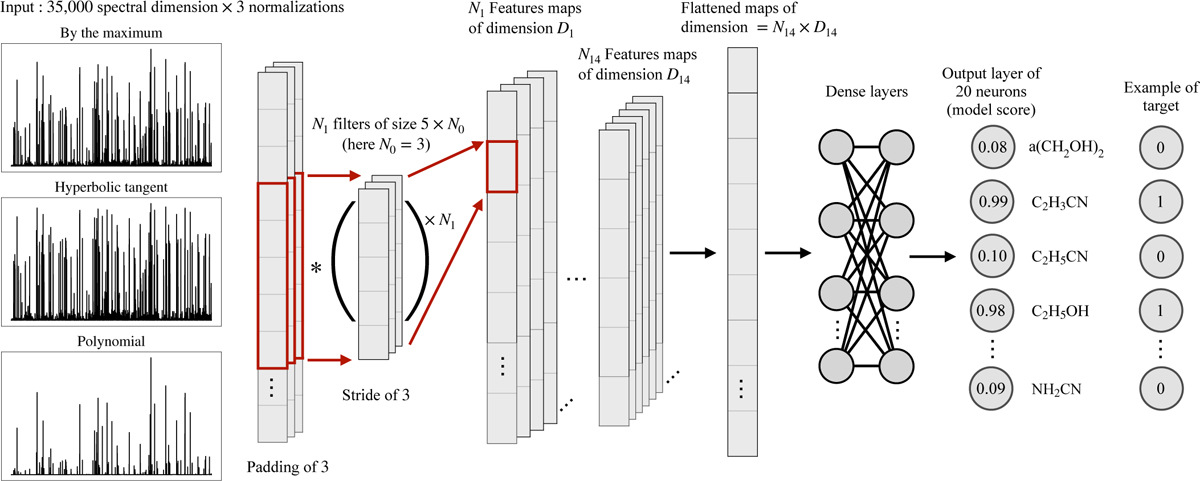
Fig. 2
Download original image
CNN architecture scheme. Input data form an example of a composite spectrum according to the three normalizations, i.e., by the maximum (top), hyperbolic tangent (center), and polynomial (bottom). Filters are applied to the data to convolve the information and produce features maps. This operation is done for each of the convolutional layers. Dense layers then combine the extracted features and learn how to label the spectra depending on the provided target. The output layer is composed of one neuron per class giving a score between 0 and 1, independent of each other.
Current usage metrics show cumulative count of Article Views (full-text article views including HTML views, PDF and ePub downloads, according to the available data) and Abstracts Views on Vision4Press platform.
Data correspond to usage on the plateform after 2015. The current usage metrics is available 48-96 hours after online publication and is updated daily on week days.
Initial download of the metrics may take a while.