Open Access
Fig. 5
Download original image
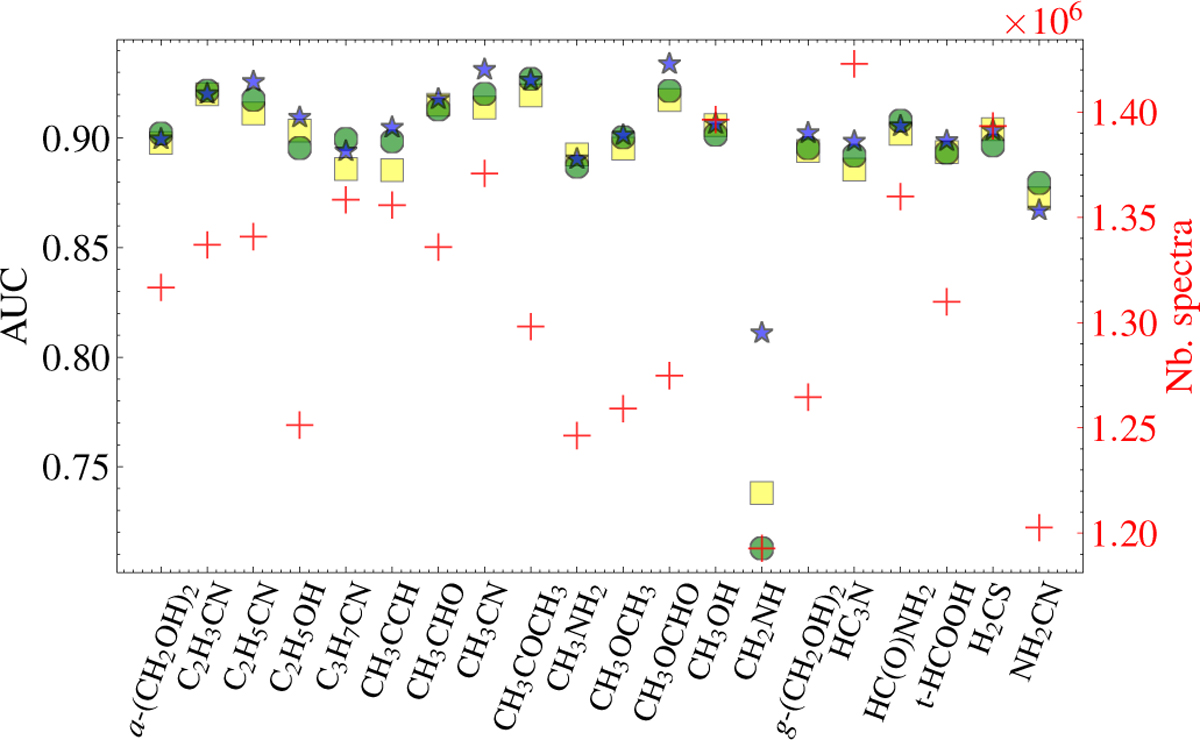
AUC as a function of molecules for three trainings of the multi-labeling CNN. The squares, triangles, and stars are the AUC values. The red crosses correspond to the number of spectra where the molecules are detected.
Current usage metrics show cumulative count of Article Views (full-text article views including HTML views, PDF and ePub downloads, according to the available data) and Abstracts Views on Vision4Press platform.
Data correspond to usage on the plateform after 2015. The current usage metrics is available 48-96 hours after online publication and is updated daily on week days.
Initial download of the metrics may take a while.