Open Access
Fig. 9
Download original image
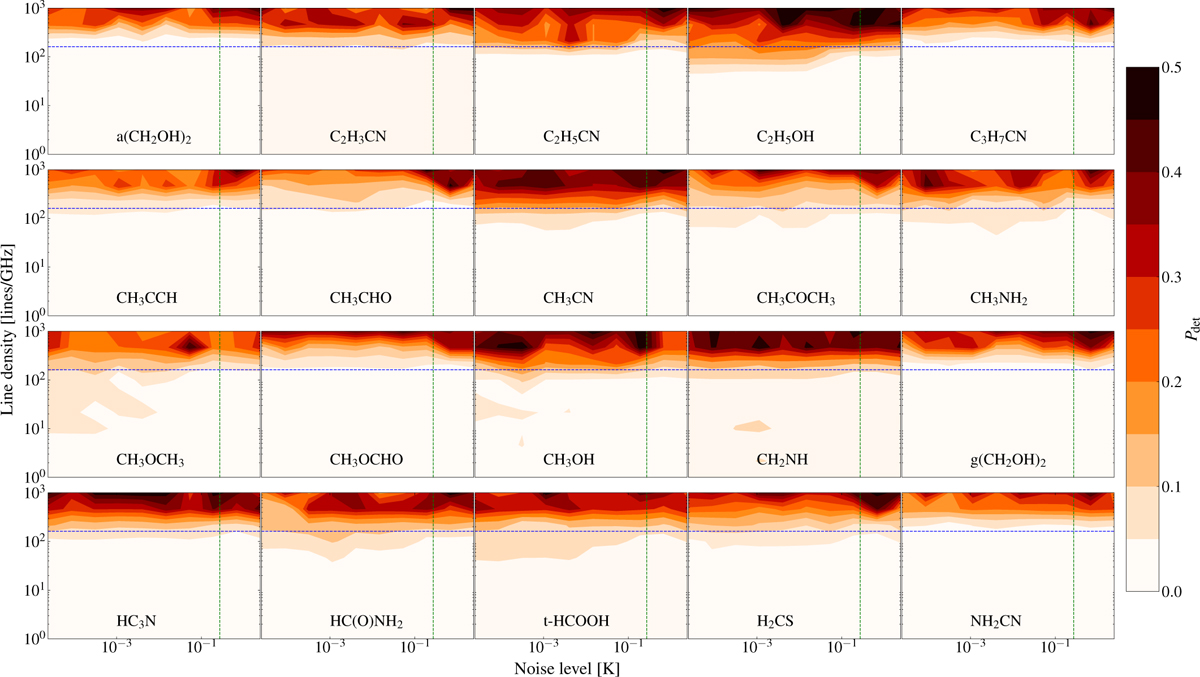
Detection probability (average on 1000 realizations) as a function of the line density and the noise level. The blue horizontal line and the green vertical line correspond to the line density and noise limits of our training dataset.
Current usage metrics show cumulative count of Article Views (full-text article views including HTML views, PDF and ePub downloads, according to the available data) and Abstracts Views on Vision4Press platform.
Data correspond to usage on the plateform after 2015. The current usage metrics is available 48-96 hours after online publication and is updated daily on week days.
Initial download of the metrics may take a while.