Fig. 1
Download original image
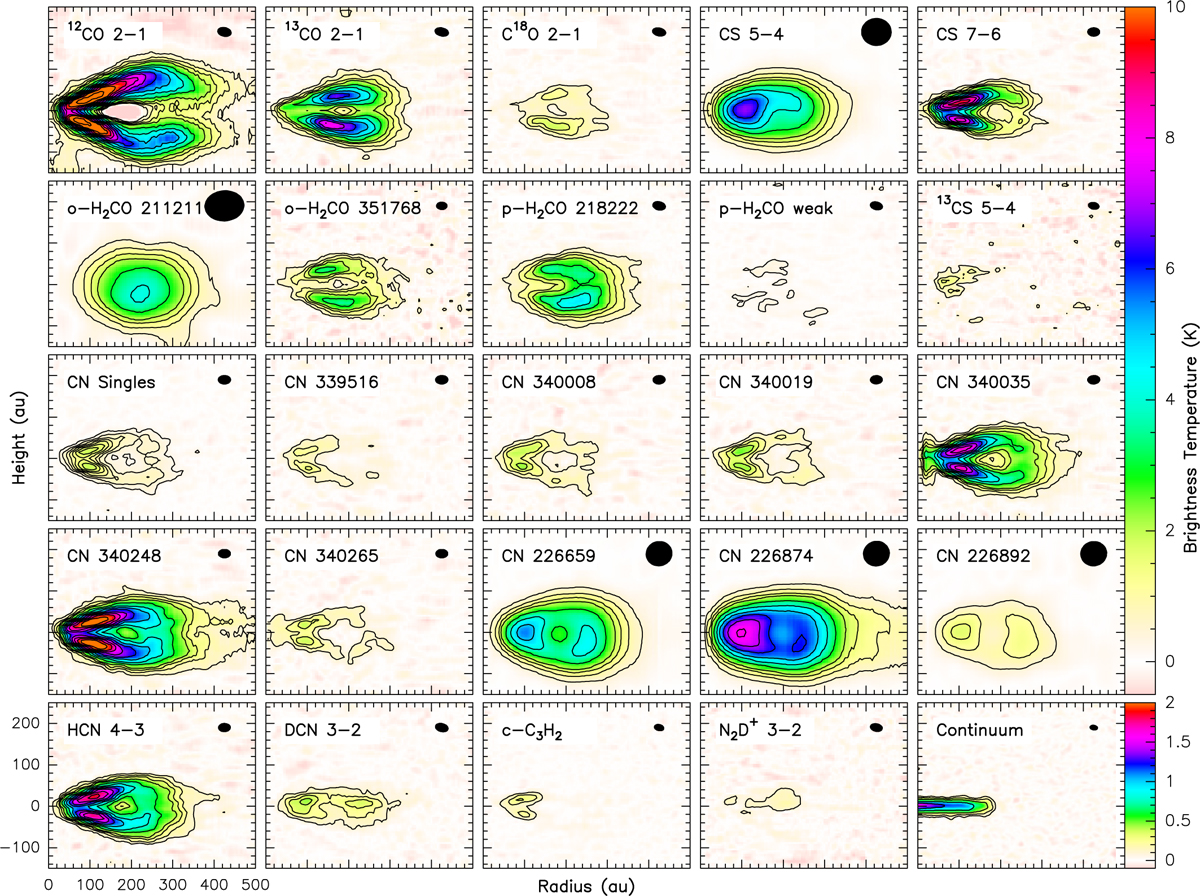
Tomographic view of the observed spectral lines showing the mean brightness as a function of radius and height (both in au). Original beam sizes are indicated in the upper-right corner of each panel. CN hyperfine transitions are labeled by their frequency in MHz. Contour levels are 0.5-2 by 0.5, 3-10 by 1, and 12-30 by 2 K (except for the weak para-H2CO line, contour, at 0.25 K only). The panel labeled “CN Singles” shows a weighted average of three unblended lines at 338 516, 340 008, and 340 019 MHz, which is shown with a contour step of 0.25 K. The continuum at 230 GHz is shown in the bottom-left panel with contour levels 0.1, 0.2, 0.4, 0.8, and 1.2 K.
Current usage metrics show cumulative count of Article Views (full-text article views including HTML views, PDF and ePub downloads, according to the available data) and Abstracts Views on Vision4Press platform.
Data correspond to usage on the plateform after 2015. The current usage metrics is available 48-96 hours after online publication and is updated daily on week days.
Initial download of the metrics may take a while.