Fig. 2
Download original image
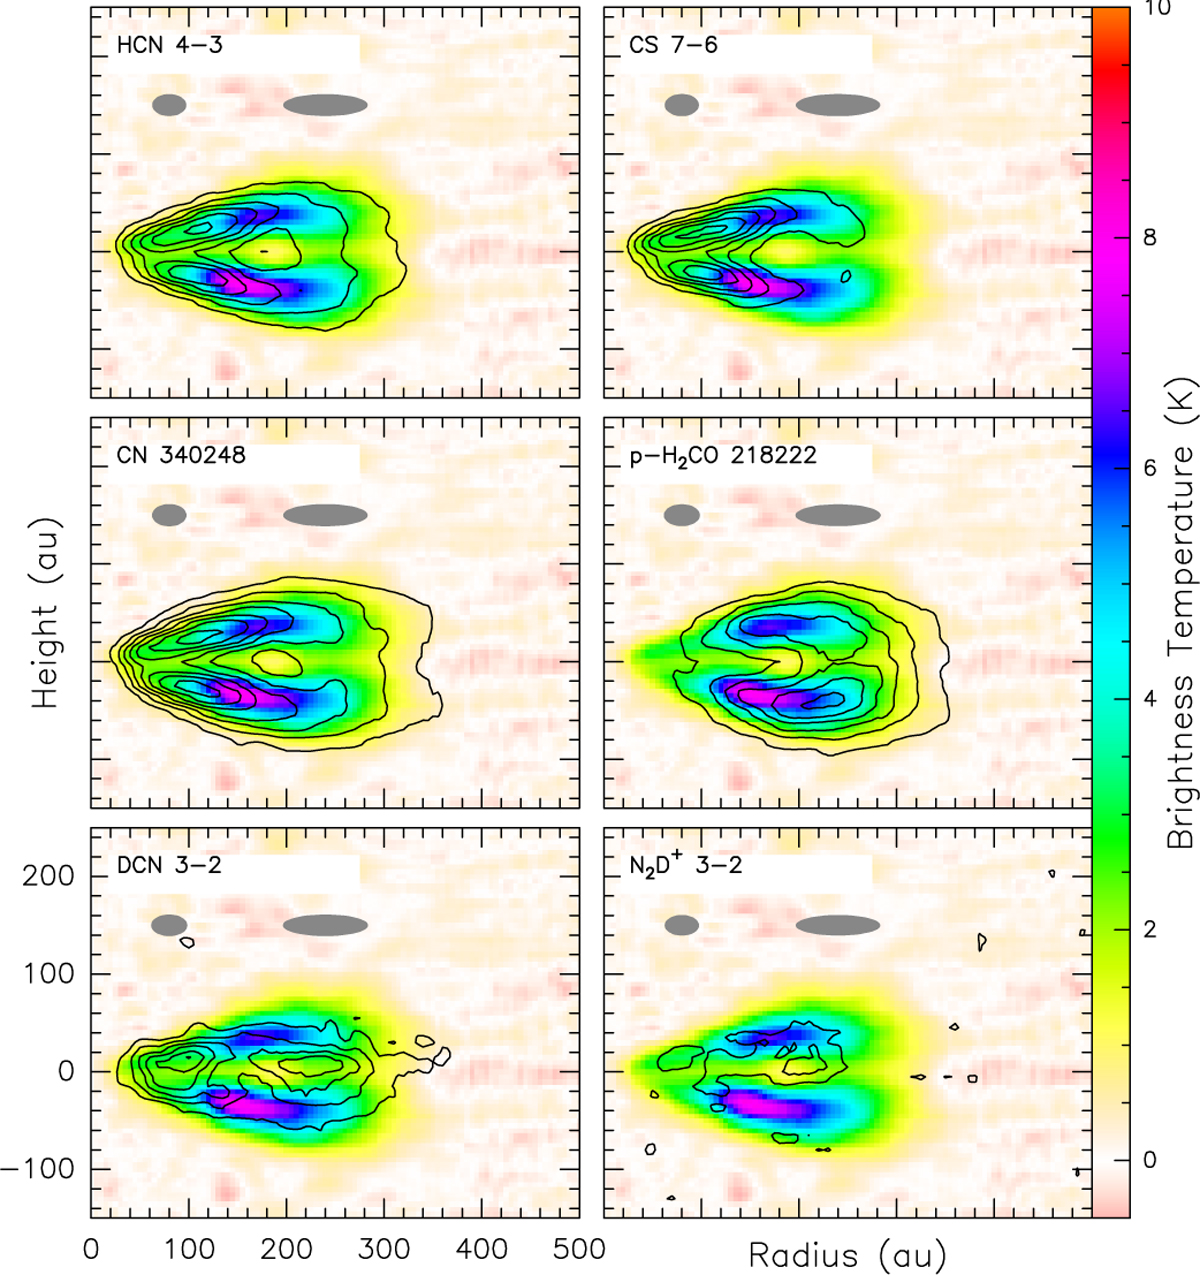
13 CO tomography in false color with superimposition of the tomographies (black contours) of HCN 4-3, CS 7-6, and CN at 340.348 GHz; p-H2CO at 218.222 GHz; and DCN 3-2 and N2D+ 3-2. Contours are in steps of 1.5 K for HCN, CS, CN, and p-H2CO; 0.75 K for DCN; and 0.375 K for N2D+. The gray ellipses indicate the impact of line width on the effective beam at 80 and 240 au
Current usage metrics show cumulative count of Article Views (full-text article views including HTML views, PDF and ePub downloads, according to the available data) and Abstracts Views on Vision4Press platform.
Data correspond to usage on the plateform after 2015. The current usage metrics is available 48-96 hours after online publication and is updated daily on week days.
Initial download of the metrics may take a while.