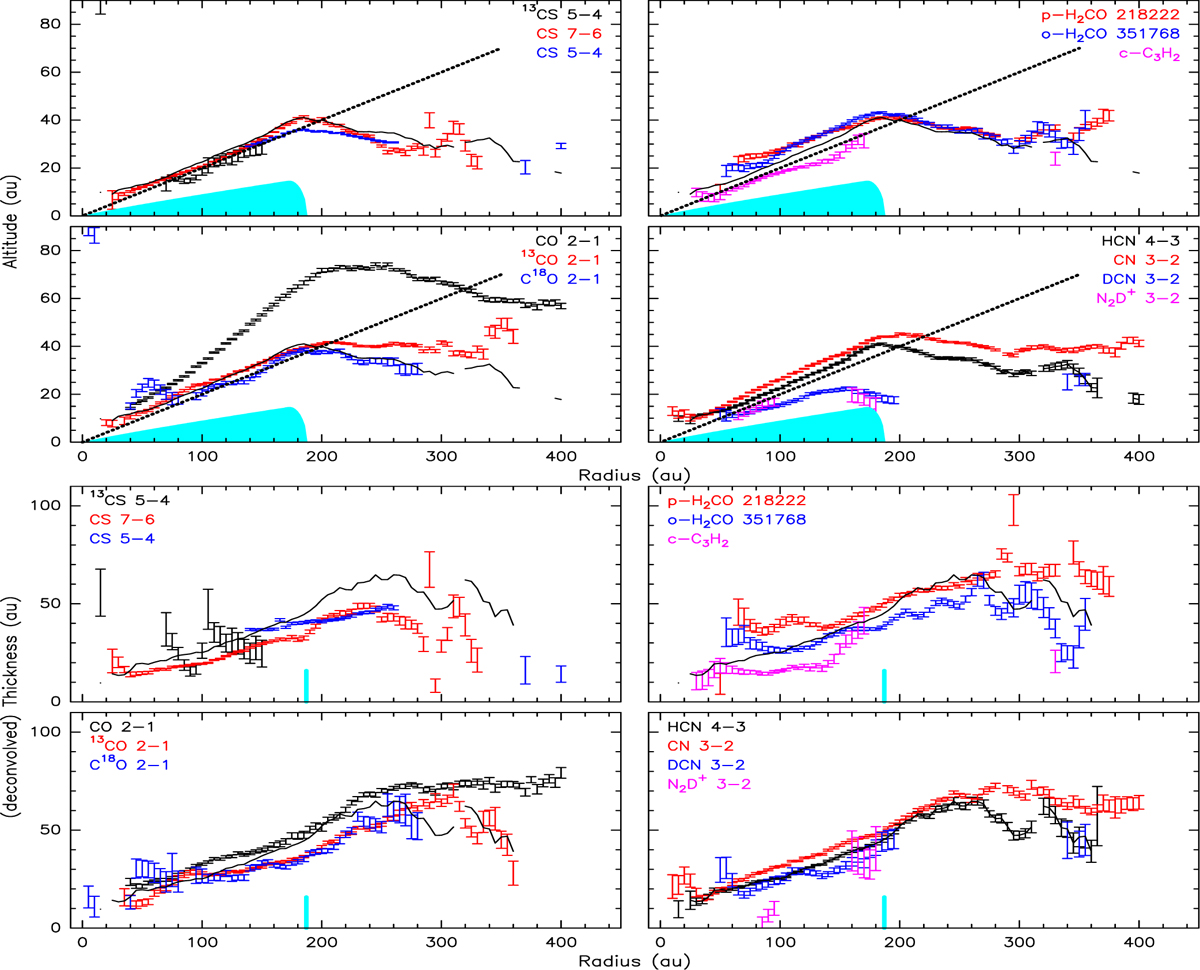
Fig. 3
Download original image
Top: altitude A(r) of the molecular layer as a function of radius. The black curve is the HCN(4-3) altitude for comparison. The cyan region indicates the approximate size of the dust disk. The dotted line corresponds to z/r = 0.2. Bottom: deconvolved thickness of the molecular layer. The deconvolution has been done assuming Gaussian shapes using the clean beam minor axis since synthesized beams are elongated almost parallel to the disk plane. The black curve is the HCN(4-3) thickness, for comparison. The cyan bar marks the edge of the dust disk.
Current usage metrics show cumulative count of Article Views (full-text article views including HTML views, PDF and ePub downloads, according to the available data) and Abstracts Views on Vision4Press platform.
Data correspond to usage on the plateform after 2015. The current usage metrics is available 48-96 hours after online publication and is updated daily on week days.
Initial download of the metrics may take a while.