Fig. 4
Download original image
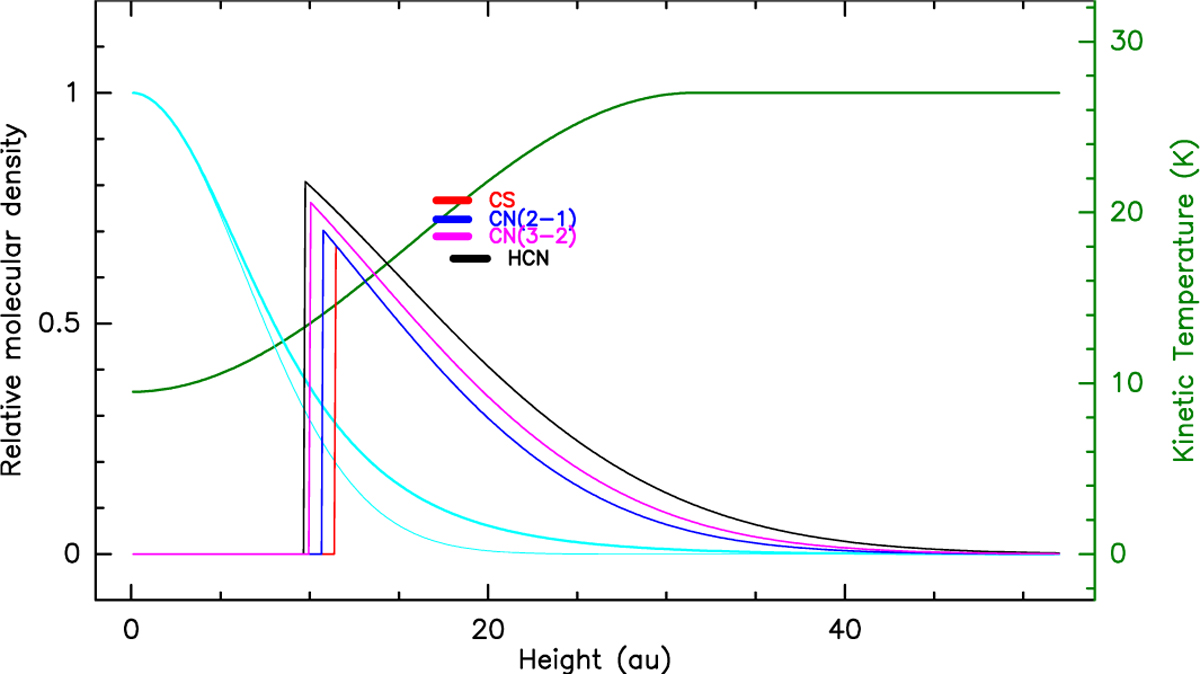
Profiles resulting from DISKFIT at 100 au. The green curve is the temperature profile, and the cyan curves indicate the H2 density structure (thin: under isothermal assumption at the mid-plane temperature (10 K); thick: using the full temperature profile) that were derived from the CO analysis by Guilloteau et al. (2025). The other colored curves are the molecular density profiles for CS (red), HCN (black), CN 2-1 (blue), and 3-2 (magenta) and are based on the parameters from Table 1. The corresponding horizontal bars indicate the measured temperatures and the density weighted average height of the emission.
Current usage metrics show cumulative count of Article Views (full-text article views including HTML views, PDF and ePub downloads, according to the available data) and Abstracts Views on Vision4Press platform.
Data correspond to usage on the plateform after 2015. The current usage metrics is available 48-96 hours after online publication and is updated daily on week days.
Initial download of the metrics may take a while.