Fig. 4.
Download original image
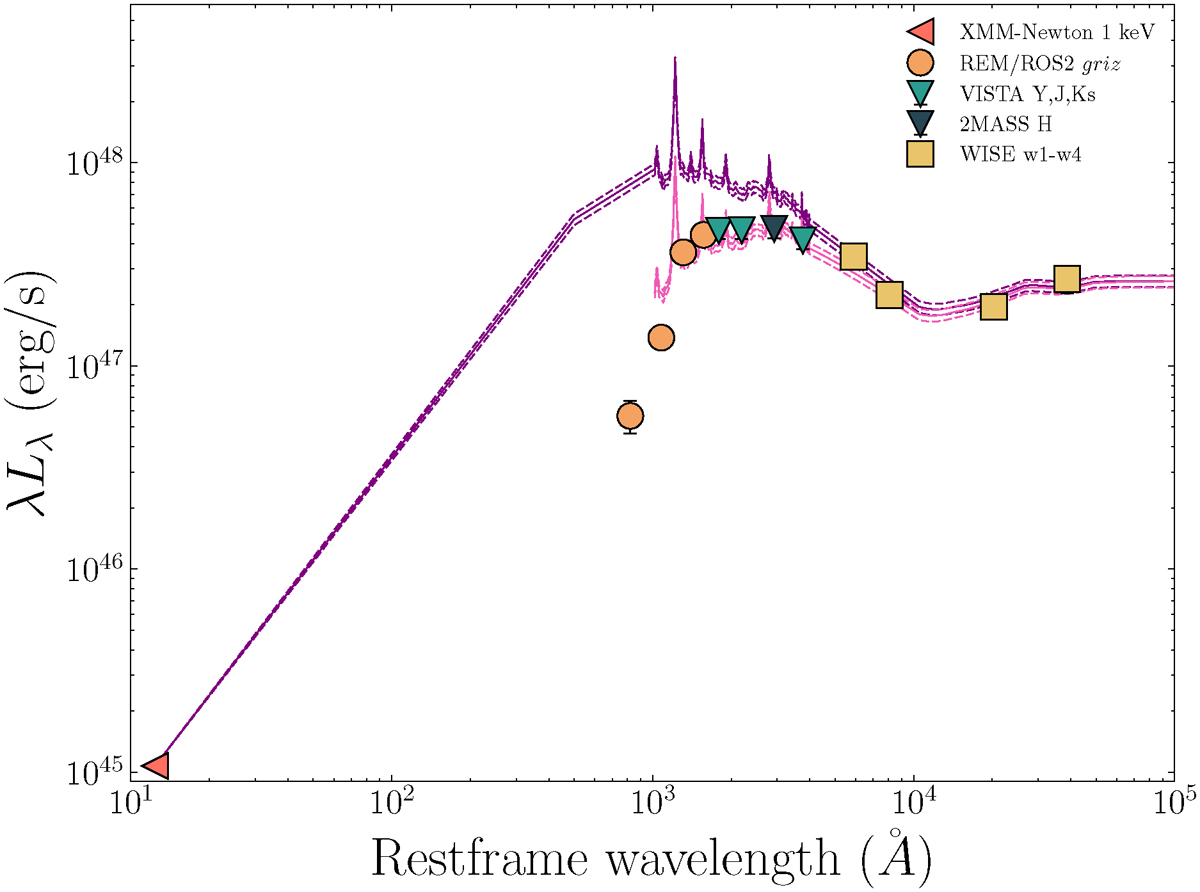
Best-fit de-reddened and reddened SEDs with 1σ errors for SMSS J2157 (purple and pink lines, respectively), as derived in Sect. 3.2. The 1 keV luminosity is shown as a left-pointing coral red triangle; REM/ROS2 g, r, i, z data are represented by orange circles; Y, J, and Ks points from VISTA are shown as down-pointing green triangles; the H point from 2MASS is represented by a down-pointing blue triangle; and golden yellow squares represent the W1-W4 WISE channels. The uncertainties of data points are shown but are smaller than the symbol size.
Current usage metrics show cumulative count of Article Views (full-text article views including HTML views, PDF and ePub downloads, according to the available data) and Abstracts Views on Vision4Press platform.
Data correspond to usage on the plateform after 2015. The current usage metrics is available 48-96 hours after online publication and is updated daily on week days.
Initial download of the metrics may take a while.