Fig. 5.
Download original image
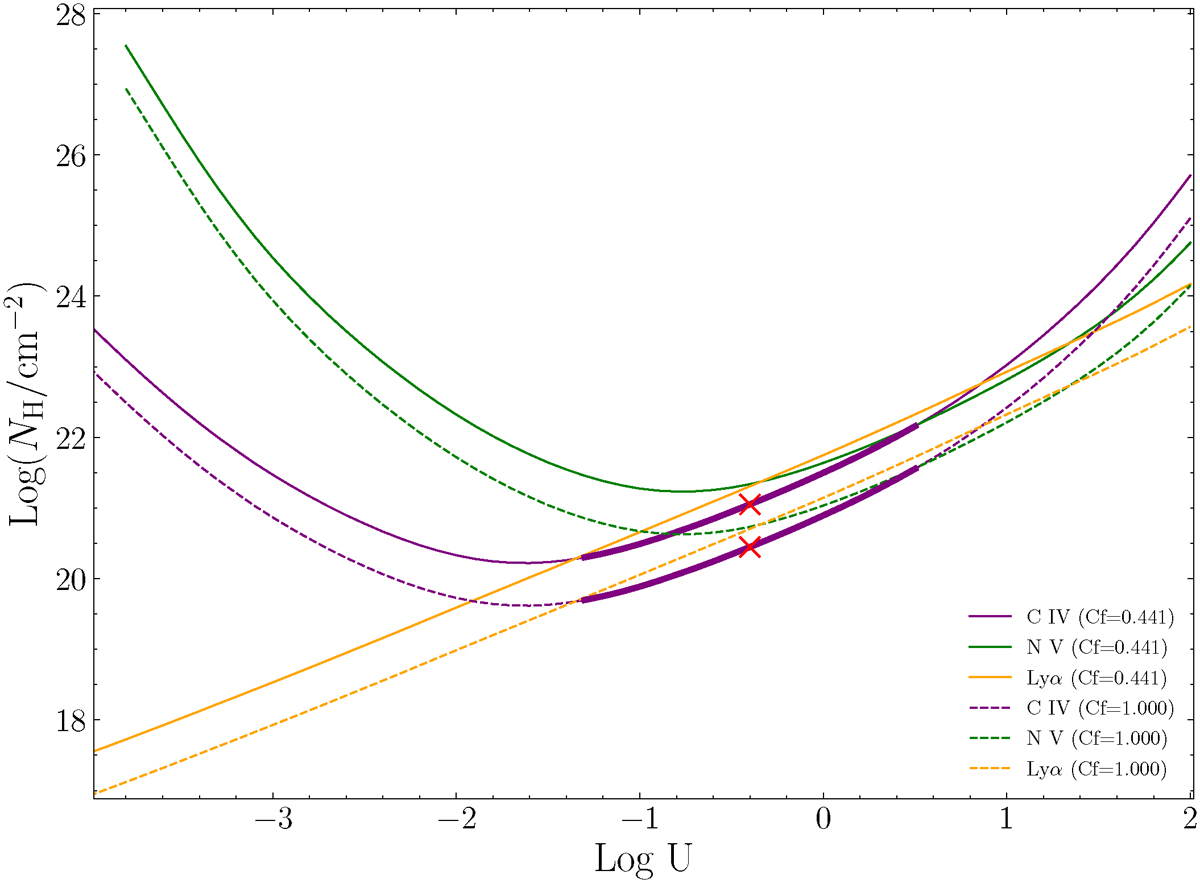
Theoretical values of the ionization parameter U and the computed column density NH from Nion as derived from Eq. (4) (see Sect. 3.3). Solid and dashed lines correspond to the values of NH derived using Cfmin and Cfmax, respectively. The purple curves show the NH constraint from CIV, while the green and orange curves represent the upper limits from NV and Lyα, respectively. Bold lines indicate the allowed solutions for NH and U, while the red crosses mark the median values of the solutions adopted in Eq. (5).
Current usage metrics show cumulative count of Article Views (full-text article views including HTML views, PDF and ePub downloads, according to the available data) and Abstracts Views on Vision4Press platform.
Data correspond to usage on the plateform after 2015. The current usage metrics is available 48-96 hours after online publication and is updated daily on week days.
Initial download of the metrics may take a while.