Fig. 6.
Download original image
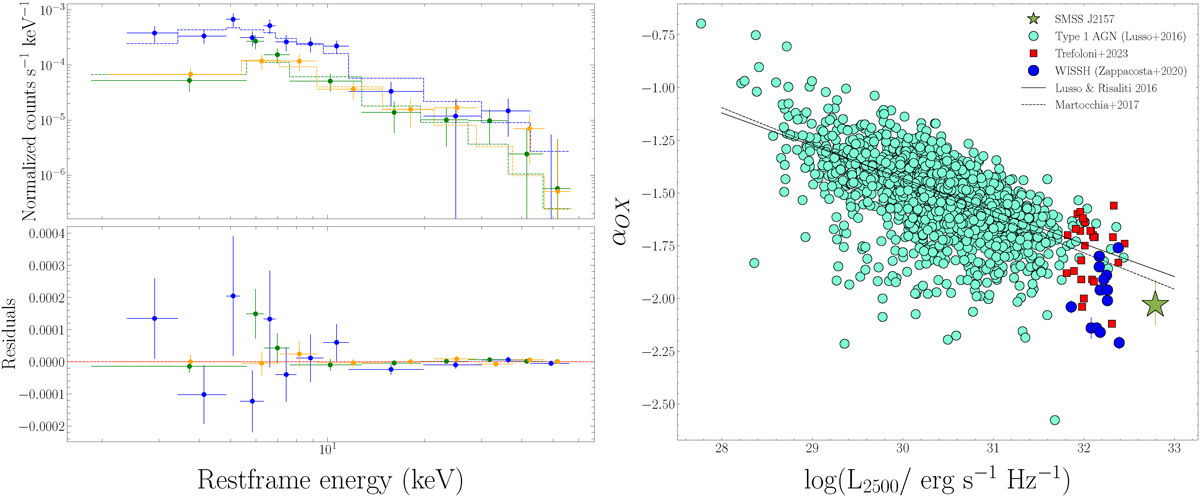
Top-left panel: X-ray EPIC spectra (data) and relative best-fit power-law models modified by intrinsic absorption (dashed lines) and in the lower plot the residuals, i.e., data minus best-fit models. Blue, green, and orange colors refer to the pn, MOS1, and MOS2 detectors, respectively. Energies are reported at the rest-frame. Right panel: αox vs L2500. SMSS J2157 is reported as green star, while green, red and blue colors indicate a compilation of type 1 AGNs (Lusso & Risaliti 2016), bright UV-selected quasars (Nardini et al. 2019), and optically/IR selected bright QSOs from the WISSH sample (Zappacosta et al. 2020), respectively. Solid and dashed black lines report the relations inferred by Lusso & Risaliti (2016) and Martocchia et al. (2017).
Current usage metrics show cumulative count of Article Views (full-text article views including HTML views, PDF and ePub downloads, according to the available data) and Abstracts Views on Vision4Press platform.
Data correspond to usage on the plateform after 2015. The current usage metrics is available 48-96 hours after online publication and is updated daily on week days.
Initial download of the metrics may take a while.