Fig. 1.
Download original image
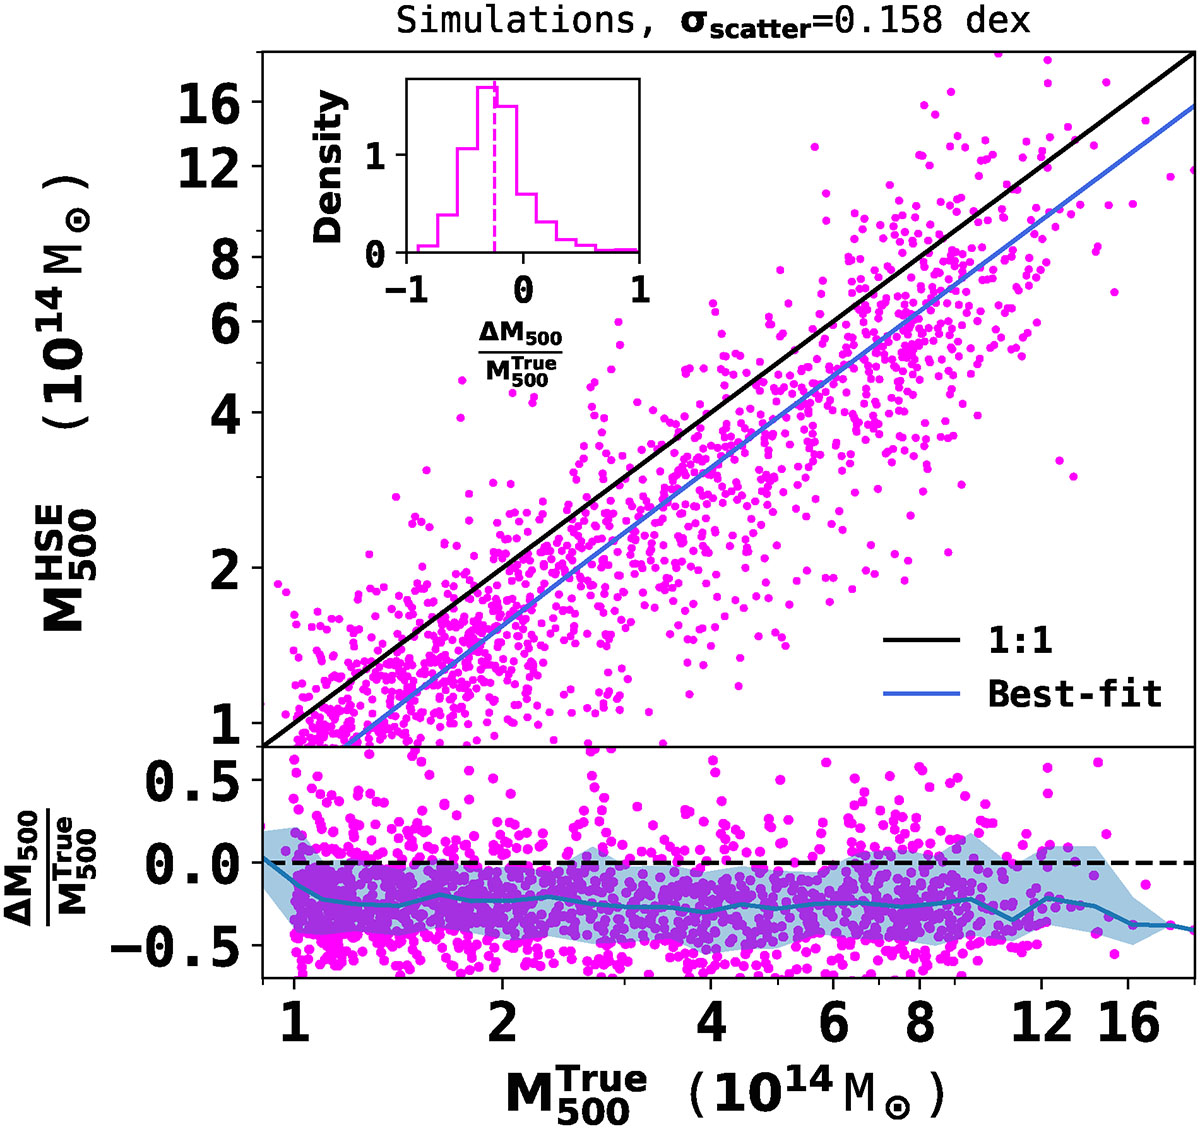
Comparison of the hydrostatic mass estimates ![]() to the true mass
to the true mass ![]() for a sample of 1655 galaxy clusters in THE THREE HUNDRED PROJECT. The blue line indicates the best-fitting linear relation, and the black line corresponds to the 1-to-1 relation. The blue line and shaded region in the lower panel show the median and 1σ dispersion of the fractional residual distribution, respectively, considering logarithmic binning. The inset shows the distribution of fractional residuals and the vertical dashed line show the median of the fractional dispersion of −0.24.
for a sample of 1655 galaxy clusters in THE THREE HUNDRED PROJECT. The blue line indicates the best-fitting linear relation, and the black line corresponds to the 1-to-1 relation. The blue line and shaded region in the lower panel show the median and 1σ dispersion of the fractional residual distribution, respectively, considering logarithmic binning. The inset shows the distribution of fractional residuals and the vertical dashed line show the median of the fractional dispersion of −0.24.
Current usage metrics show cumulative count of Article Views (full-text article views including HTML views, PDF and ePub downloads, according to the available data) and Abstracts Views on Vision4Press platform.
Data correspond to usage on the plateform after 2015. The current usage metrics is available 48-96 hours after online publication and is updated daily on week days.
Initial download of the metrics may take a while.