Fig. 10.
Download original image
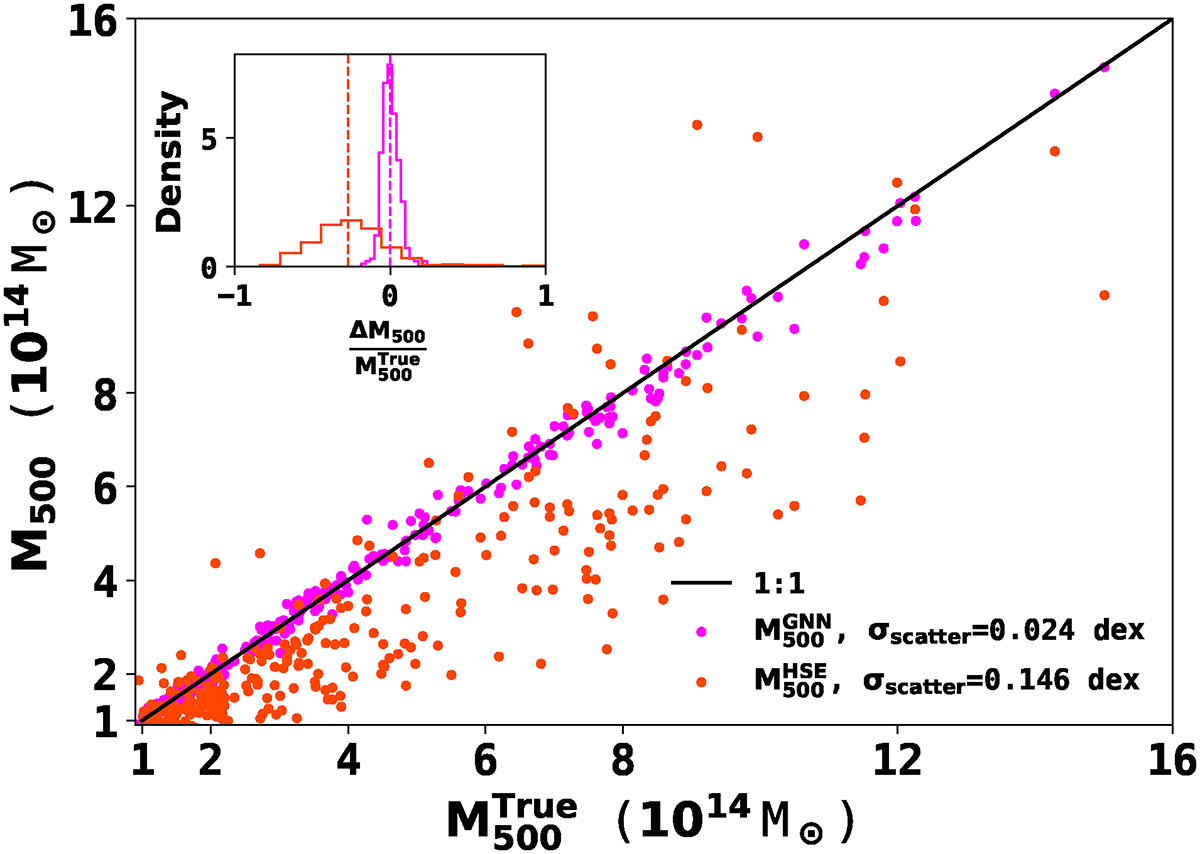
Comparison of GNN and hydrostatic equation predictions for M500 using an unaugmented test sample of 350 galaxy clusters. The black line represents a 1-to-1 relation. The magenta and orange points respectively compare the GNN predictions and the hydrostatic predictions with the true masses. The inset shows the distribution of residuals for both approaches; the vertical lines show the median of the distributions.
Current usage metrics show cumulative count of Article Views (full-text article views including HTML views, PDF and ePub downloads, according to the available data) and Abstracts Views on Vision4Press platform.
Data correspond to usage on the plateform after 2015. The current usage metrics is available 48-96 hours after online publication and is updated daily on week days.
Initial download of the metrics may take a while.