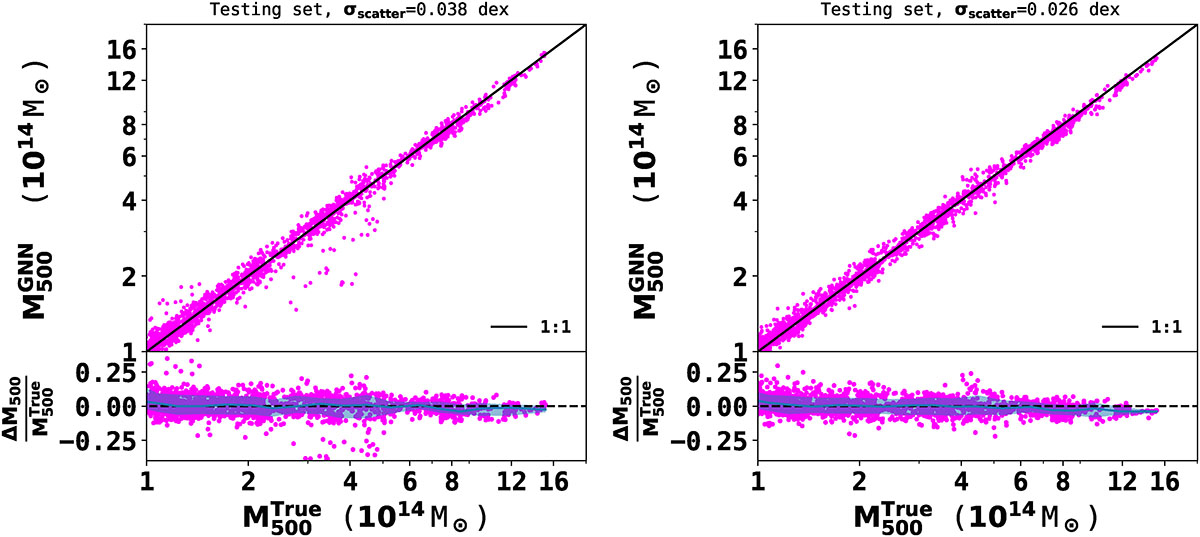
Fig. D.1.
Download original image
Performance comparison of the lower-dimensional three-feature model (left) and the higher-dimensional six-feature model (right) using the testing sample. The two subpanels show the fractional residual distributions; the solid blue line and the shaded regions represent the median and 1σ dispersion, respectively. The lower-dimensional model yields a relatively large scatter of 0.038 dex for the testing sample. In contrast, the higher-dimensional model shows no improved constraints compared to the fiducial model, with a scatter of 0.026 dex for the testing sample.
Current usage metrics show cumulative count of Article Views (full-text article views including HTML views, PDF and ePub downloads, according to the available data) and Abstracts Views on Vision4Press platform.
Data correspond to usage on the plateform after 2015. The current usage metrics is available 48-96 hours after online publication and is updated daily on week days.
Initial download of the metrics may take a while.