Fig. E.1.
Download original image
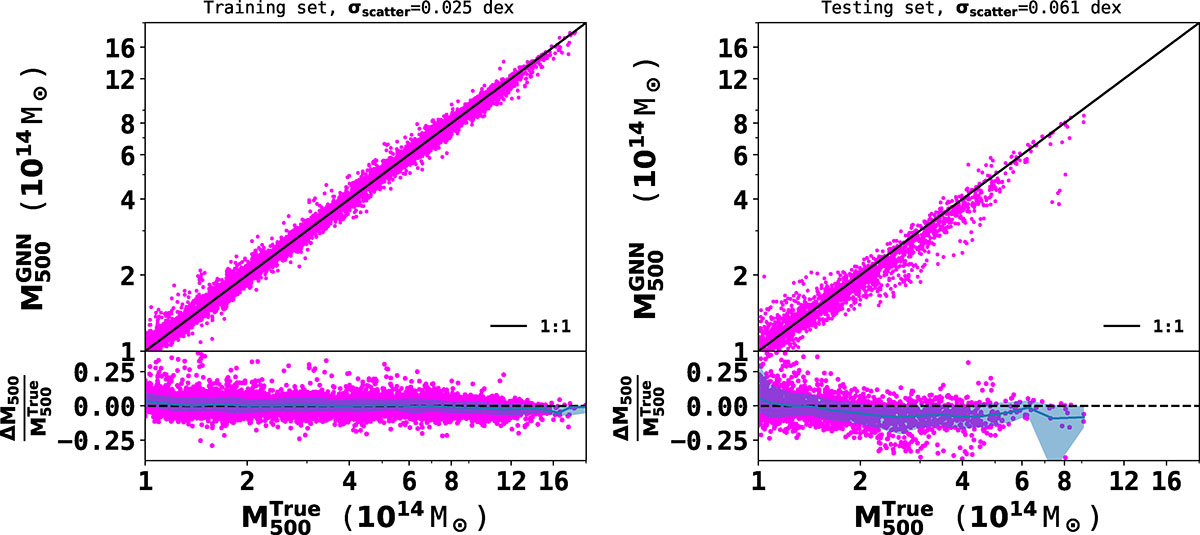
GNN predicted masses, ![]() , vs true cluster masses,
, vs true cluster masses, ![]() , for the training (left) and testing (right) samples, drawn from the original unaugmented dataset across different redshift bins. The black line shows the self-similar relation. The two subpanels show the fractional residuals; the solid blue line indicates the median and the shaded region represents the 1σ scatter. As expected, the model predictions for the training set are effectively unbiased, while the testing sample exhibits a mild average bias of (1 − b) = 0.96, reflecting redshift-dependent effects.
, for the training (left) and testing (right) samples, drawn from the original unaugmented dataset across different redshift bins. The black line shows the self-similar relation. The two subpanels show the fractional residuals; the solid blue line indicates the median and the shaded region represents the 1σ scatter. As expected, the model predictions for the training set are effectively unbiased, while the testing sample exhibits a mild average bias of (1 − b) = 0.96, reflecting redshift-dependent effects.
Current usage metrics show cumulative count of Article Views (full-text article views including HTML views, PDF and ePub downloads, according to the available data) and Abstracts Views on Vision4Press platform.
Data correspond to usage on the plateform after 2015. The current usage metrics is available 48-96 hours after online publication and is updated daily on week days.
Initial download of the metrics may take a while.