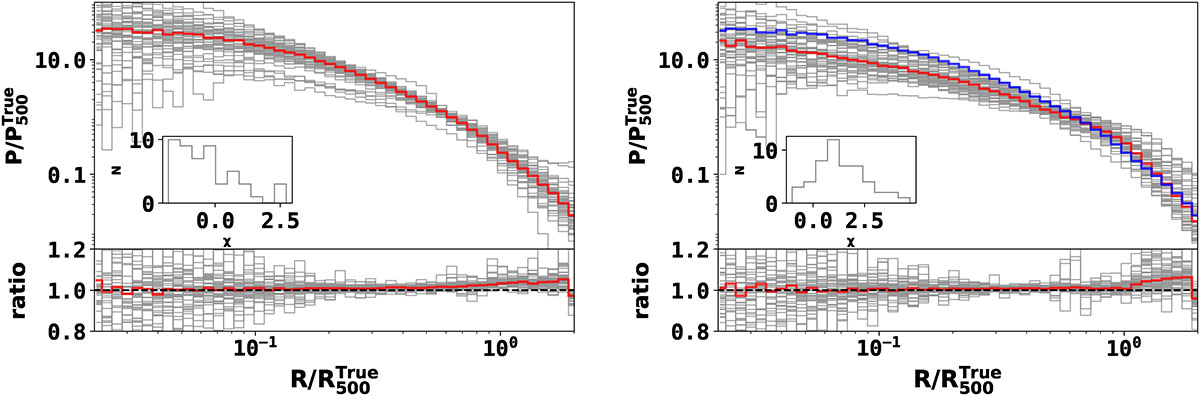
Fig. 2.
Download original image
Pressure profiles of clusters with low and high fractional dispersions in M500 derived using hydrostatic equilibrium. The grey lines show the pressure profiles of the 50 clusters having the lowest (left panel) and highest (right panel) fractional dispersions. The thick red lines indicate the corresponding median profiles. The bottom panel displays the ratio of reconstructed to true pressure profiles. In the right panel, we have also plotted the median profile for the lowest dispersion set with a thick blue line for comparison. The insets illustrates the distribution of the relaxation parameter χ for the same clusters.
Current usage metrics show cumulative count of Article Views (full-text article views including HTML views, PDF and ePub downloads, according to the available data) and Abstracts Views on Vision4Press platform.
Data correspond to usage on the plateform after 2015. The current usage metrics is available 48-96 hours after online publication and is updated daily on week days.
Initial download of the metrics may take a while.