Fig. 5.
Download original image
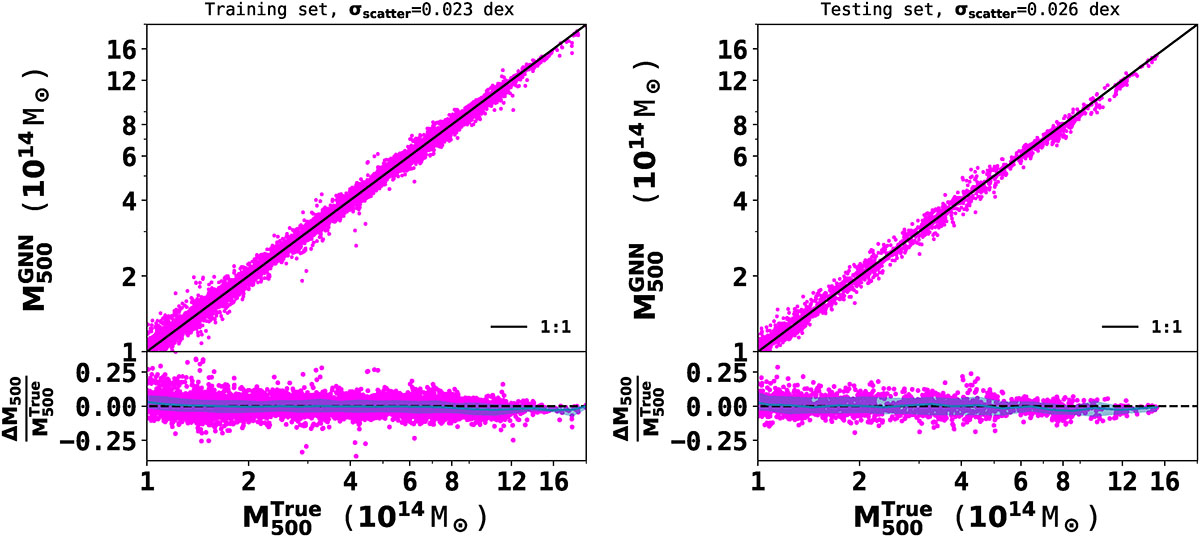
Distribution of GNN predicted masses, ![]() , vs. true cluster masses,
, vs. true cluster masses, ![]() , for the training (left) and testing (right) samples of sizes 9305 and 1950, respectively. The black line represents a 1-to-1 relation. The bottom panel in both panels shows the fractional residual distribution; the solid blue lines and shaded regions represent the median and 1σ dispersion, respectively. We find a 1σ dispersion of about 7% and 6% for the testing and training samples, respectively.
, for the training (left) and testing (right) samples of sizes 9305 and 1950, respectively. The black line represents a 1-to-1 relation. The bottom panel in both panels shows the fractional residual distribution; the solid blue lines and shaded regions represent the median and 1σ dispersion, respectively. We find a 1σ dispersion of about 7% and 6% for the testing and training samples, respectively.
Current usage metrics show cumulative count of Article Views (full-text article views including HTML views, PDF and ePub downloads, according to the available data) and Abstracts Views on Vision4Press platform.
Data correspond to usage on the plateform after 2015. The current usage metrics is available 48-96 hours after online publication and is updated daily on week days.
Initial download of the metrics may take a while.