Fig. 1.
Download original image
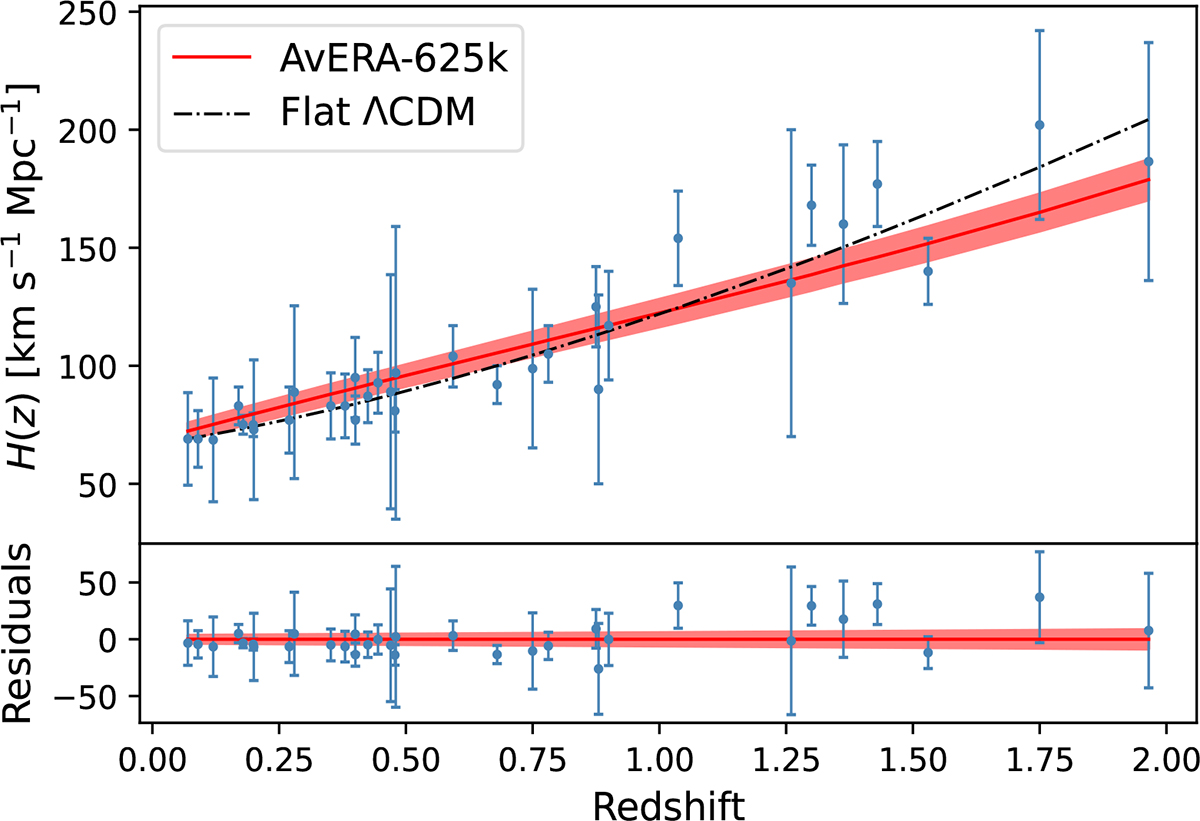
Thirty-three CC data points from Table 1 of Moresco (2024) (blue dots with error bars), shown together with the best-fit H(z) curves for the AvERA-625k model (solid red curve with 1σ confidence bands) and the flat ΛCDM model (dash-dotted black curve). The lower panel displays the residuals after subtracting the best-fit AvERA-625k H(z) curve. The best-fit parameters for both models are given in Table 1. “625k” indicates the particle number used in the AvERA simulation.
Current usage metrics show cumulative count of Article Views (full-text article views including HTML views, PDF and ePub downloads, according to the available data) and Abstracts Views on Vision4Press platform.
Data correspond to usage on the plateform after 2015. The current usage metrics is available 48-96 hours after online publication and is updated daily on week days.
Initial download of the metrics may take a while.