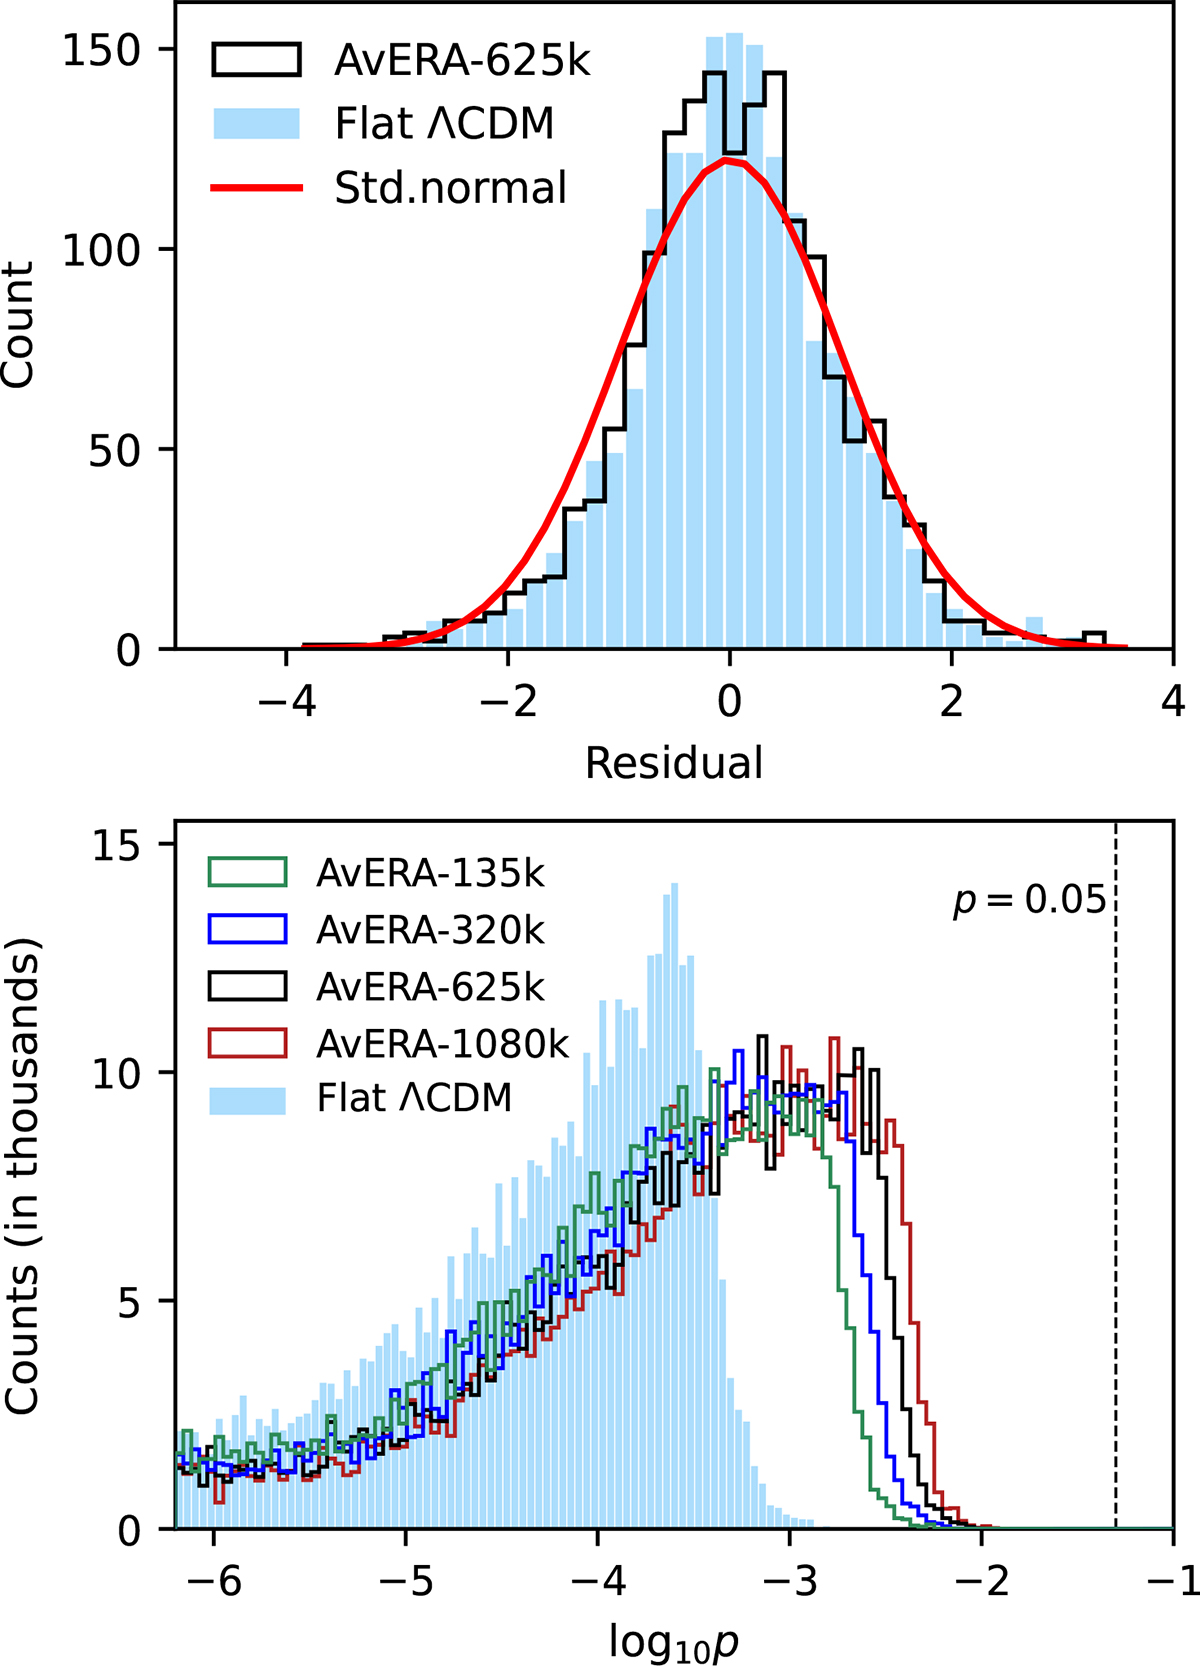
Fig. 3.
Download original image
Upper panel: Histograms of normalized residuals for the best-fit AvERA-625k and flat ΛCDM models, fit to the Pantheon+ SN Ia data (Scolnic et al. 2022). The red curve represents the standard normal distribution expected for the true model underlying the data. Lower panel: Histograms of AD-test log10p values for half a million realizations sampled from the joint posterior distributions. The dashed vertical line marks the significance threshold of p = 0.05 (log10p = −1.301) for consistency with the null hypothesis of being the true model. While none of the realizations reach this level, the preference for the AvERA model is clearly evident.
Current usage metrics show cumulative count of Article Views (full-text article views including HTML views, PDF and ePub downloads, according to the available data) and Abstracts Views on Vision4Press platform.
Data correspond to usage on the plateform after 2015. The current usage metrics is available 48-96 hours after online publication and is updated daily on week days.
Initial download of the metrics may take a while.