Open Access
Fig. 1
Download original image
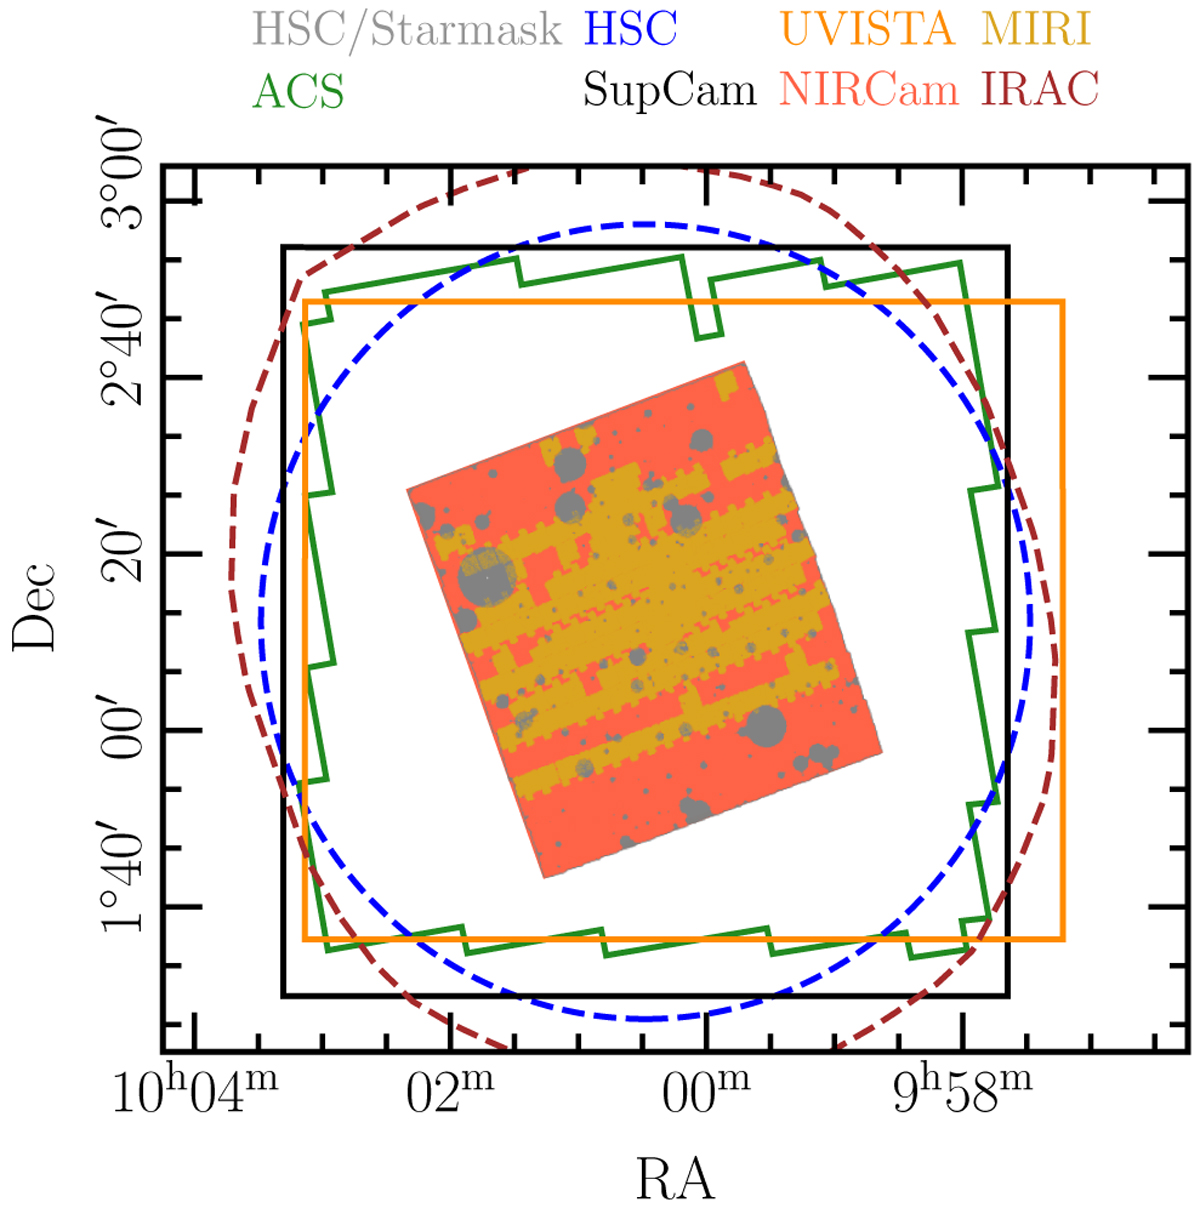
Survey footprint in the COSMOS field. The regions show the footprints of different imaging instruments color coded accordingly. The JWST footprint from NIRCam and MIRI is shown in the colored areas. The gray regions mark the area affected by HSC bright star masks.
Current usage metrics show cumulative count of Article Views (full-text article views including HTML views, PDF and ePub downloads, according to the available data) and Abstracts Views on Vision4Press platform.
Data correspond to usage on the plateform after 2015. The current usage metrics is available 48-96 hours after online publication and is updated daily on week days.
Initial download of the metrics may take a while.