Fig. 10
Download original image
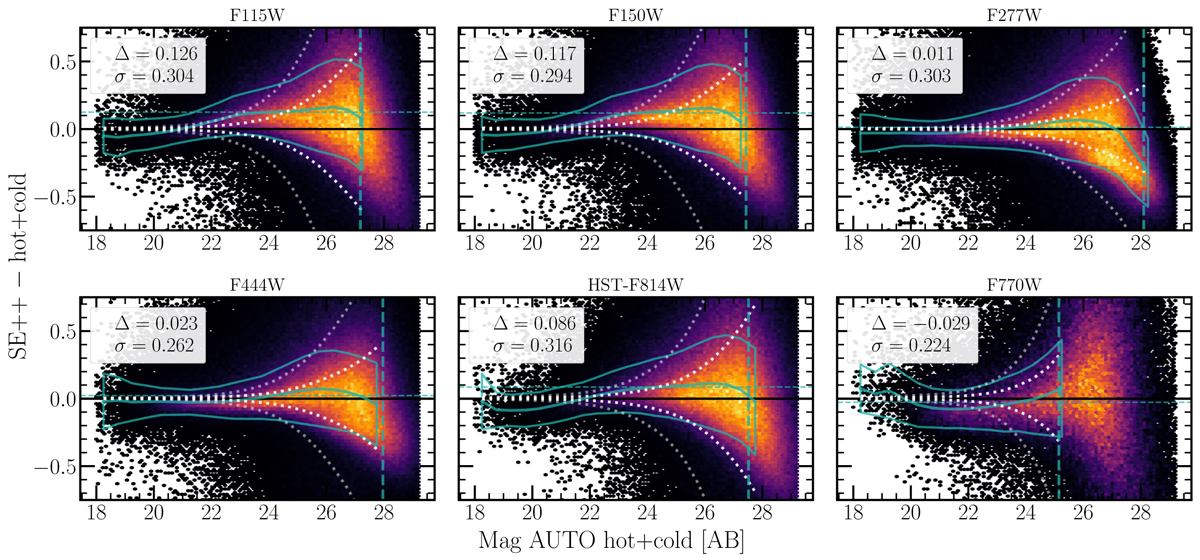
Photometric comparison between SE++ model magnitudes and auto magnitudes from the hot+cold catalog, as a function of auto magnitude. The auto photometry is corrected to total as described in Sect. 3.4.3. The panels show the following bands: F115W (top left), F150W (top center), F277W (top right), F444W (bottom left), HST F814W (bottom center), and F770W (bottom right). In each panel, the solid teal line indicates the running median offset, while the envelope denotes the 3σ-clipped standard deviation. The dotted white curves show the ±1σ and ±3σ envelopes of the combined photometric uncertainties. The vertical dashed teal line marks the 5σ depth in each band. Summary statistics report the median offset, Δ, and standard deviation, σ, for sources brighter than this limit. Sources with S/N < 3 and warn_flag > 2 are removed from the comparison.
Current usage metrics show cumulative count of Article Views (full-text article views including HTML views, PDF and ePub downloads, according to the available data) and Abstracts Views on Vision4Press platform.
Data correspond to usage on the plateform after 2015. The current usage metrics is available 48-96 hours after online publication and is updated daily on week days.
Initial download of the metrics may take a while.