Fig. 11
Download original image
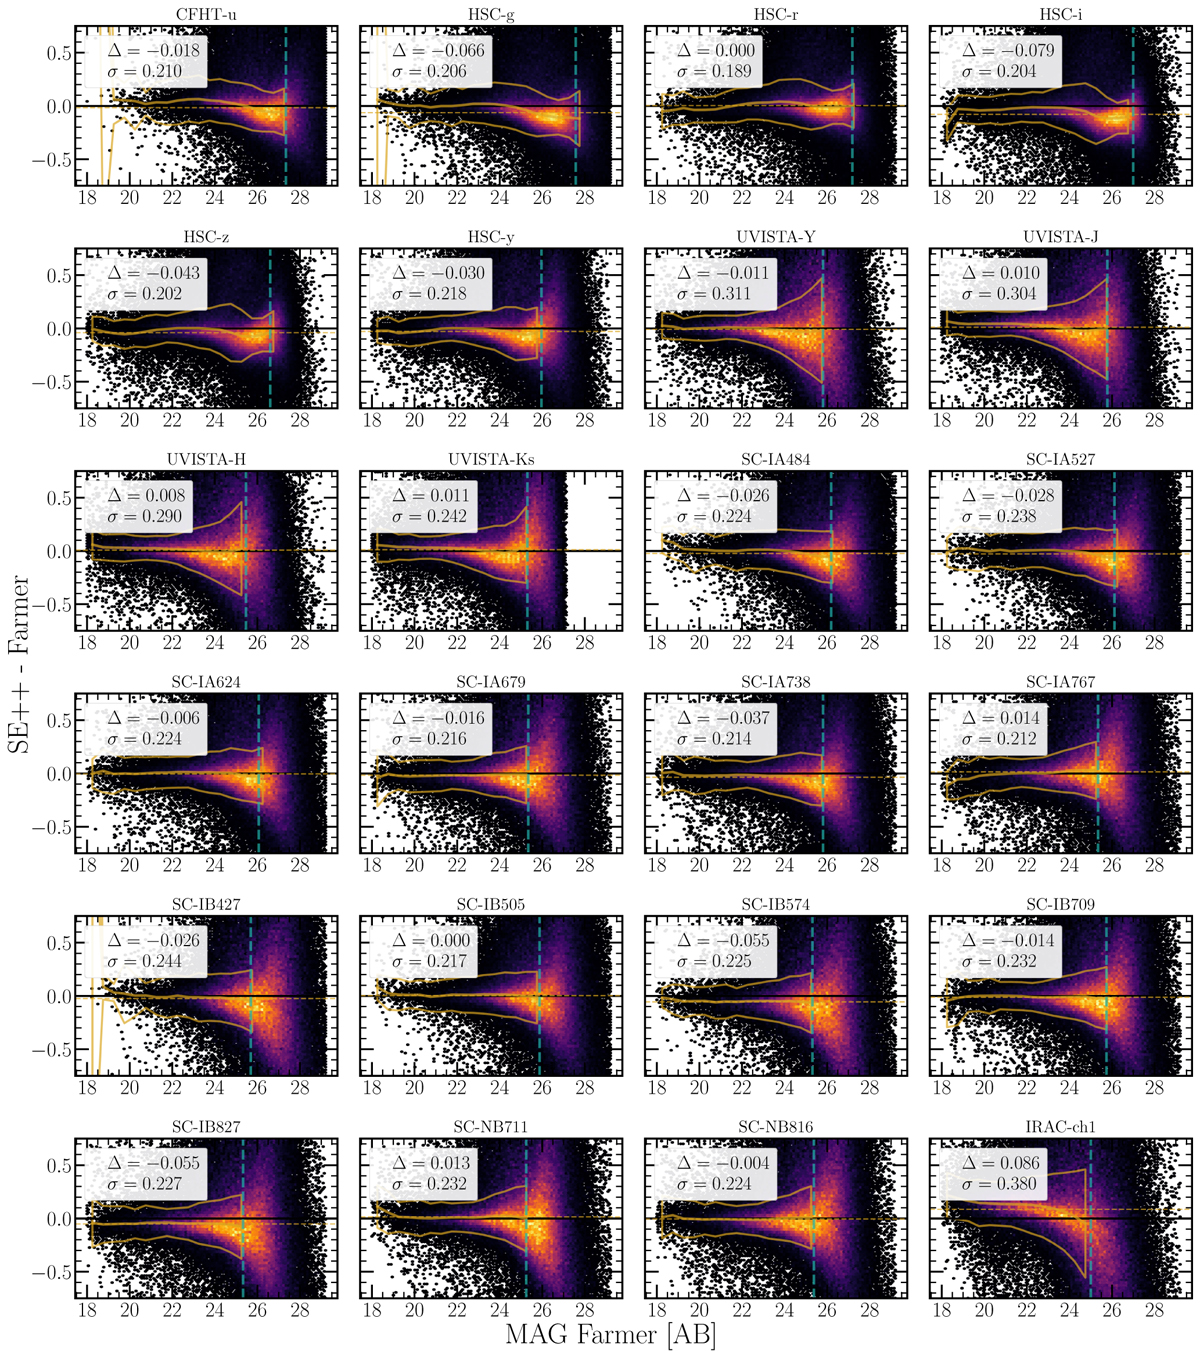
Photometric comparison with the COSMOS2020 THE FARMER catalog. The density histogram shows the difference between SE++ and THE FARMER as a function of THE FARMER magnitude. The solid yellow line shows the median offset, while the envelope marks the 3σ-clipped standard deviation. The dashed line shows the median offset computed down to the 5σ depth magnitude, shown by the vertical, dashed teal line. The legend shows the average offset and standard deviation for magnitudes brighter than the 5σ depth.
Current usage metrics show cumulative count of Article Views (full-text article views including HTML views, PDF and ePub downloads, according to the available data) and Abstracts Views on Vision4Press platform.
Data correspond to usage on the plateform after 2015. The current usage metrics is available 48-96 hours after online publication and is updated daily on week days.
Initial download of the metrics may take a while.