Fig. 17
Download original image
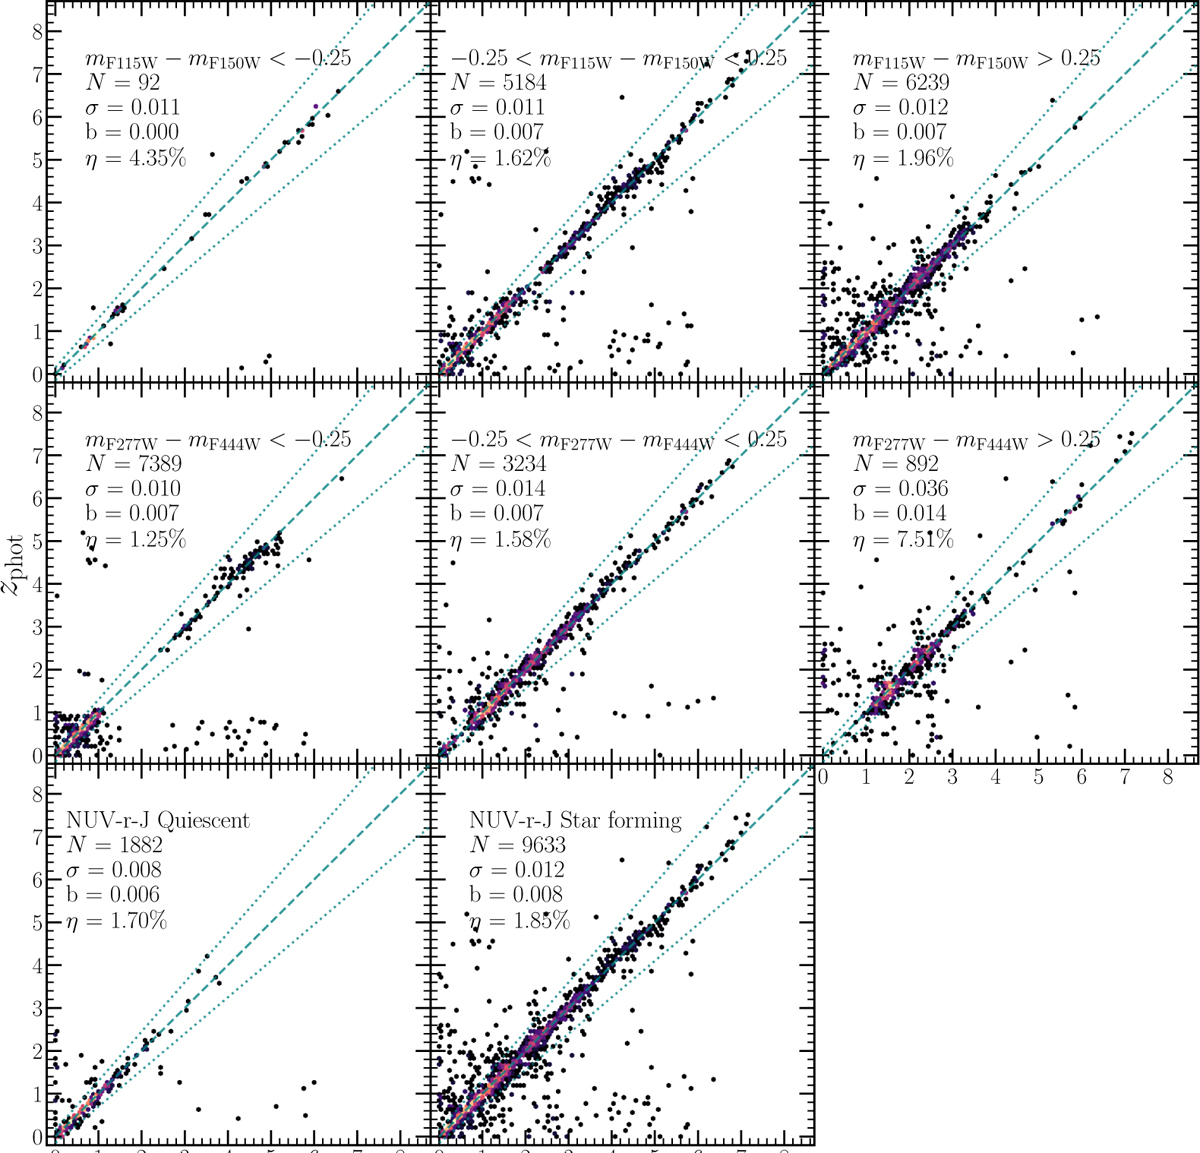
Photometric versus spectroscopic redshift comparison for different color-selected samples. The top row shows F115W–F150W, while the middle row shows F277W–F444W color-selected samples at < −0.25 (left), −0.25 < color < 0.25 (middle), and > 0.25 (right column). The bottom row shows the performance for quiescent and star-forming galaxies selected using the NUVrJ diagram, i.e., (NUV − r) > 3 × (r − J) + 1 and (NUV − r) > 3.1. The dashed teal line marks the one-to-one relation, while the dotted lines correspond to zphot > ±0.15 (1 + zspec). The number of sources in the magnitude selection (N), median absolute deviation (σ), overall bias (b) and the outlier fraction (η) are noted in each panel.
Current usage metrics show cumulative count of Article Views (full-text article views including HTML views, PDF and ePub downloads, according to the available data) and Abstracts Views on Vision4Press platform.
Data correspond to usage on the plateform after 2015. The current usage metrics is available 48-96 hours after online publication and is updated daily on week days.
Initial download of the metrics may take a while.