Fig. 24
Download original image
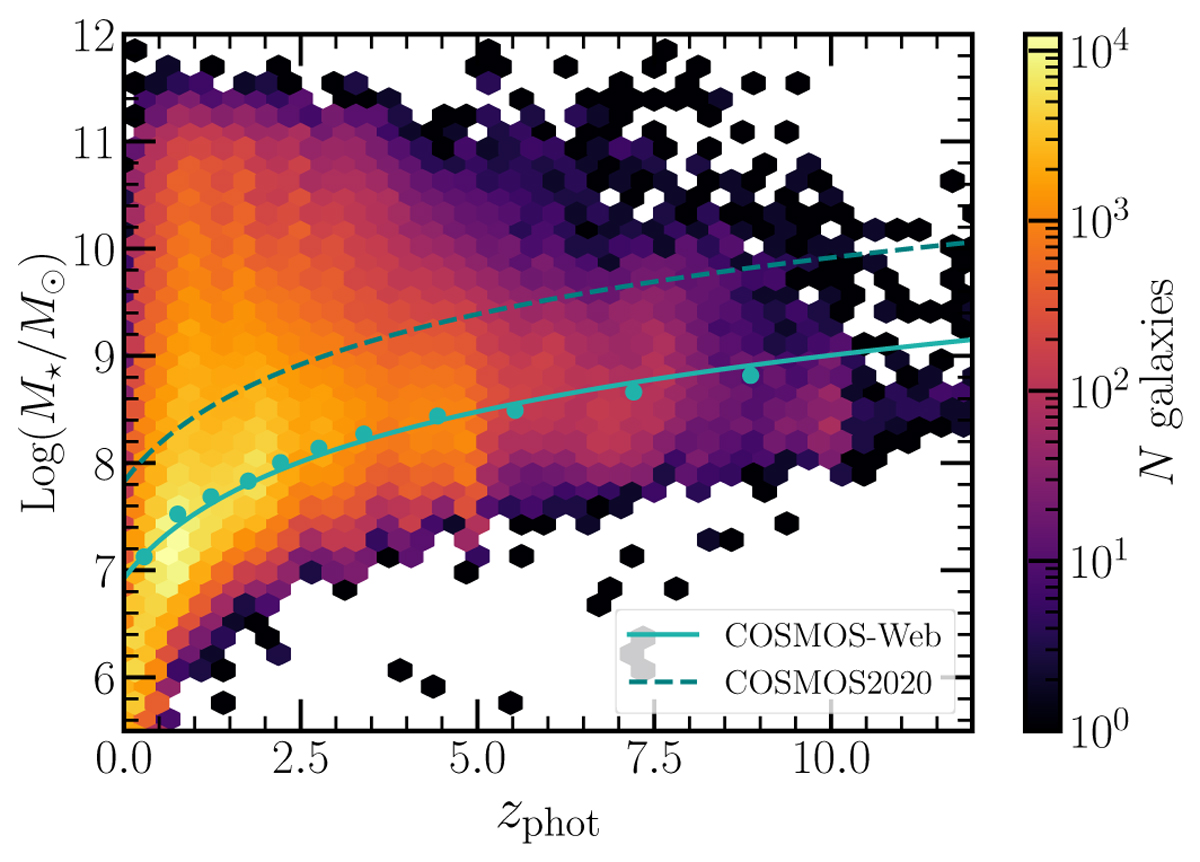
Galaxy stellar mass versus redshift diagram for the complete sample of the COSMOS-Web catalog. The circles show the computed stellar mass completeness limit derived by rescaling the stellar masses to the limiting magnitude of the survey and taking the 90th percentile of this distribution (following Pozzetti et al. 2010), while the solid curve shows the best-fit (1 + z) polynomial. The dashed line shows the completeness in the COSMOS2020 catalog that is about 1 dex shallower in M⋆.
Current usage metrics show cumulative count of Article Views (full-text article views including HTML views, PDF and ePub downloads, according to the available data) and Abstracts Views on Vision4Press platform.
Data correspond to usage on the plateform after 2015. The current usage metrics is available 48-96 hours after online publication and is updated daily on week days.
Initial download of the metrics may take a while.