Fig. 26
Download original image
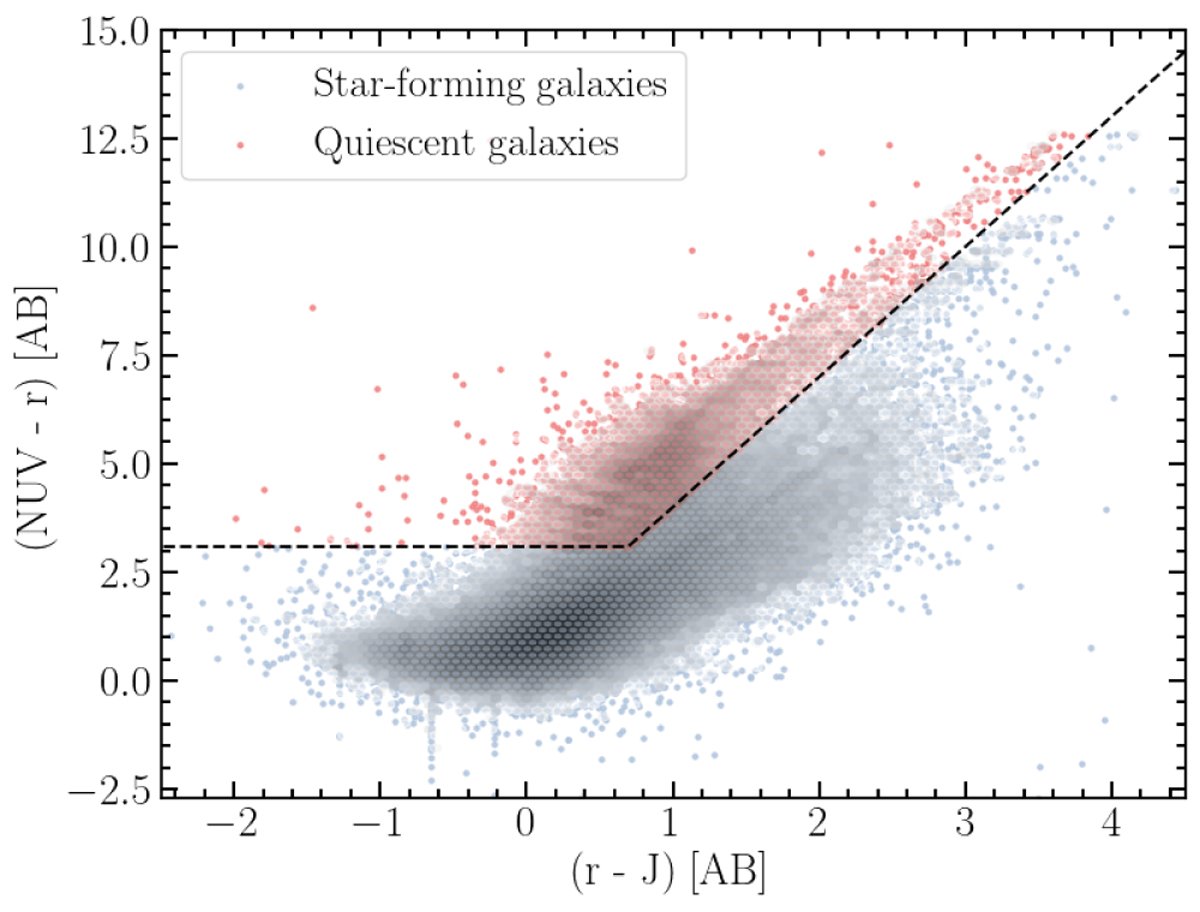
Rest-frame NUV − r − J color-color diagram showing the distribution of galaxies at redshifts between 1 < z < 3 of the COSMOS-Web sample. Quiescent galaxies are highlighted in red, while star-forming galaxies are represented in blue. The dashed black line shows the selection criteria (Ilbert et al. 2013) for both populations.
Current usage metrics show cumulative count of Article Views (full-text article views including HTML views, PDF and ePub downloads, according to the available data) and Abstracts Views on Vision4Press platform.
Data correspond to usage on the plateform after 2015. The current usage metrics is available 48-96 hours after online publication and is updated daily on week days.
Initial download of the metrics may take a while.