Fig. 5
Download original image
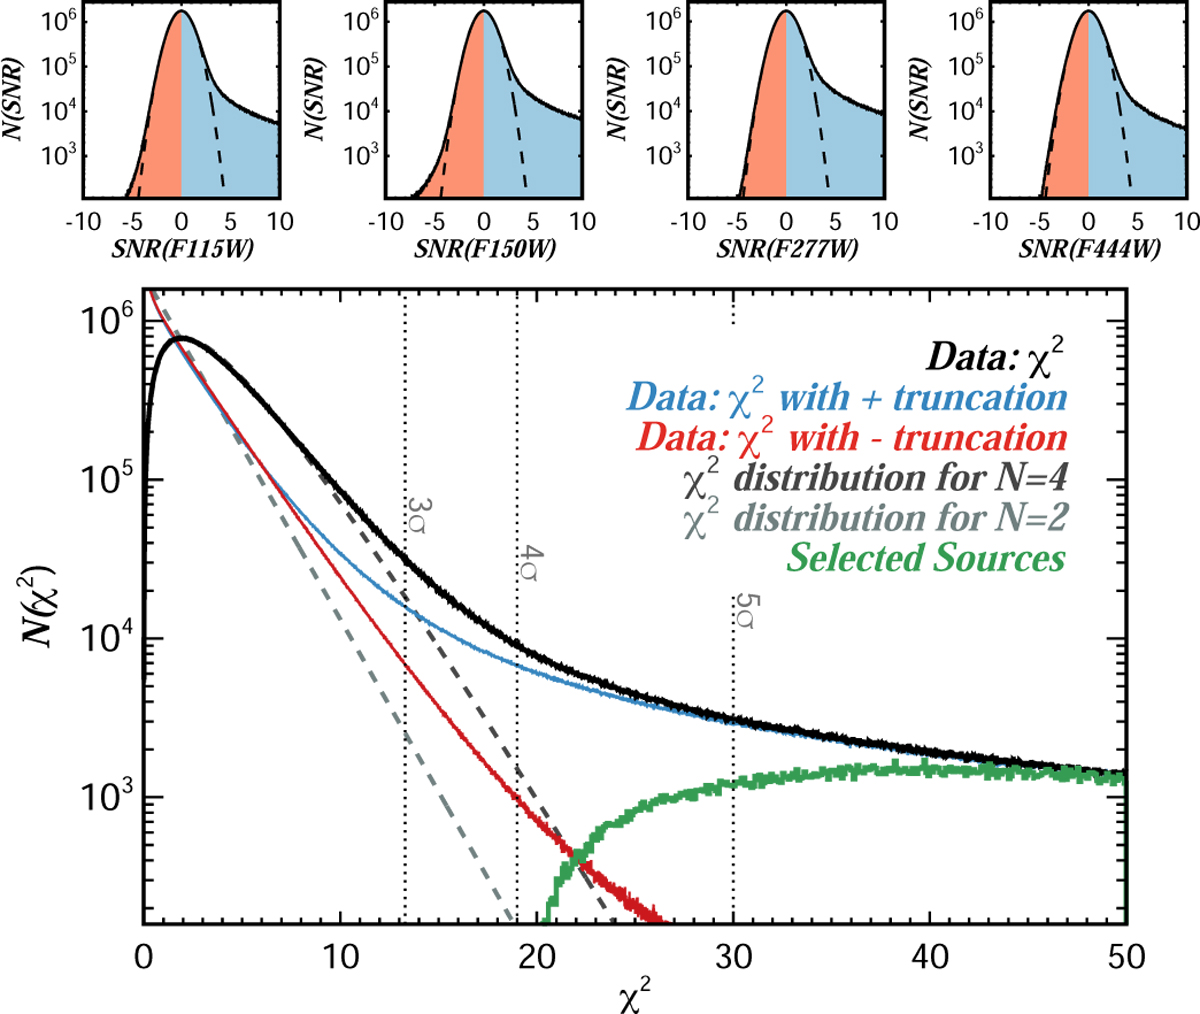
Distribution of pixels in the PSF-homogenized, noise-equalized NIRCam maps (top panels) and χ2 distribution for the quadrature sum of the four NIRCam S/N maps (bottom panel). We show the distributions without truncation (black), with positive truncation ![]() (blue), and with negative truncation
(blue), and with negative truncation ![]() (red). The χ2 distribution for degrees of freedom N = 4 and N = 2 are shown in dark and light dashed gray lines. The distribution of the sources’ maximum
(red). The χ2 distribution for degrees of freedom N = 4 and N = 2 are shown in dark and light dashed gray lines. The distribution of the sources’ maximum ![]() values that are recovered by the hot+cold catalog are shown in the green histogram. Vertical lines mark the equivalent of 3, 4, and 5σ thresholds for χ2 distributions with N = 2.
values that are recovered by the hot+cold catalog are shown in the green histogram. Vertical lines mark the equivalent of 3, 4, and 5σ thresholds for χ2 distributions with N = 2.
Current usage metrics show cumulative count of Article Views (full-text article views including HTML views, PDF and ePub downloads, according to the available data) and Abstracts Views on Vision4Press platform.
Data correspond to usage on the plateform after 2015. The current usage metrics is available 48-96 hours after online publication and is updated daily on week days.
Initial download of the metrics may take a while.