Open Access
Fig. 10.
Download original image
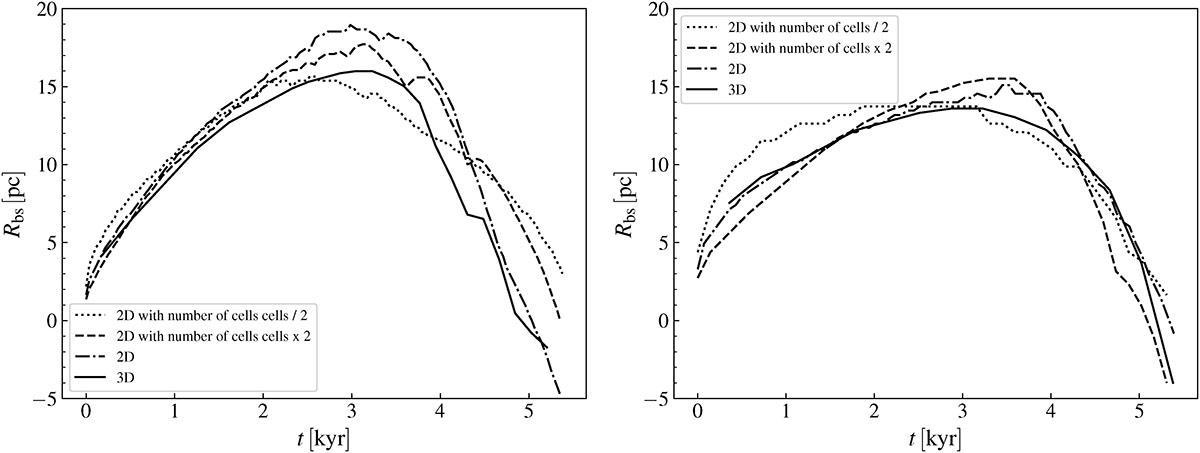
Time evolution of jet bow-shock location in S1 (left panel) and S2 (right panel) in 2D and 3D. For the 2D simulations, the calculation is done for three different resolutions: same resolution as the 3D simulation, resolution/2 (i.e. number of cells/2) and resolution ×2 (i.e. number of cells ×2).
Current usage metrics show cumulative count of Article Views (full-text article views including HTML views, PDF and ePub downloads, according to the available data) and Abstracts Views on Vision4Press platform.
Data correspond to usage on the plateform after 2015. The current usage metrics is available 48-96 hours after online publication and is updated daily on week days.
Initial download of the metrics may take a while.