Fig. 2.
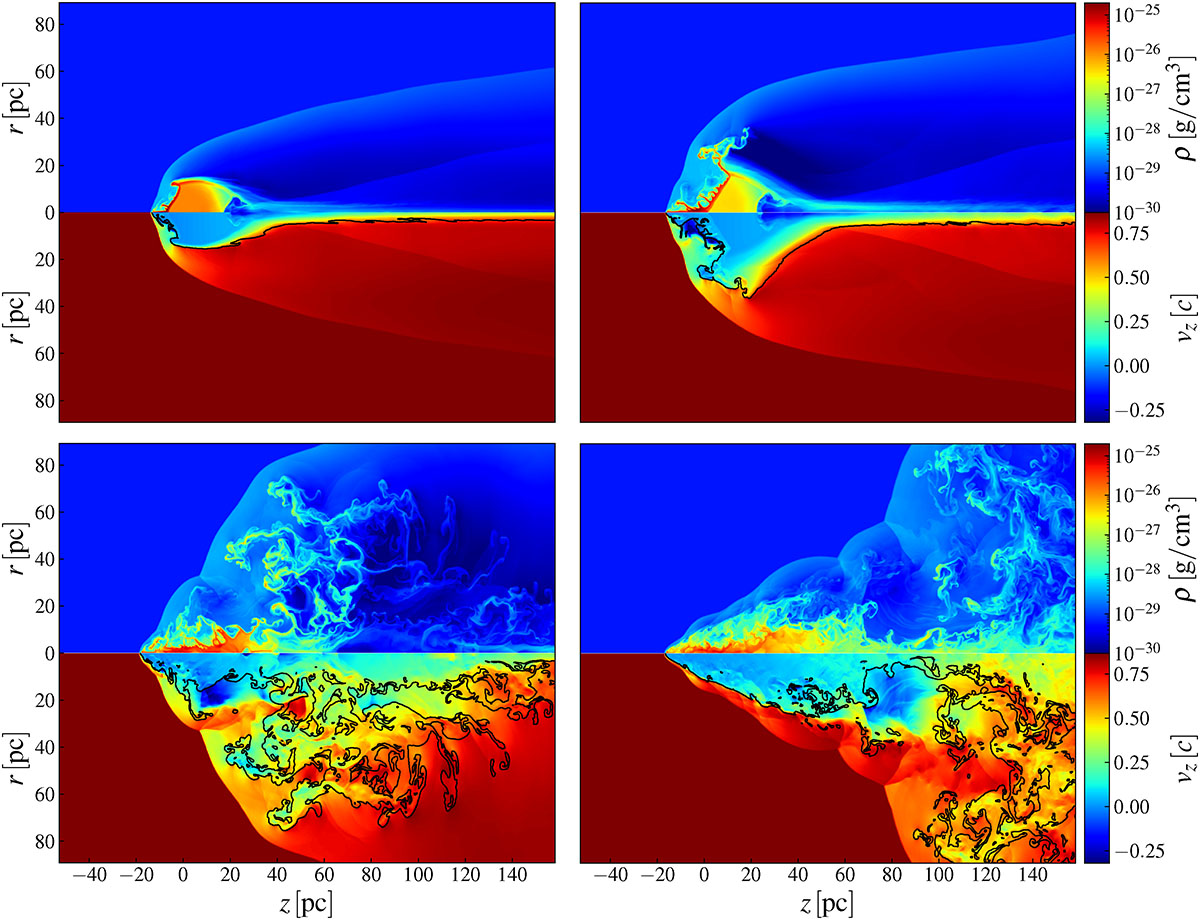
Download original image
Time evolution of rest-mass density (upper half panels) and axial velocity (lower half panels, mirror of the upper panels) for S1 in 2D. The black lines give the contour of the jet-mass fraction for the tracer value f = 0.5. The jet is propagating from the left to the right. Top left: t ≈ 1600 yr from the start of the simulation; top right: t ≈ 2300 yr; bottom left: t ≈ 3000 yr; bottom right: t ≈ 3800 yr.
Current usage metrics show cumulative count of Article Views (full-text article views including HTML views, PDF and ePub downloads, according to the available data) and Abstracts Views on Vision4Press platform.
Data correspond to usage on the plateform after 2015. The current usage metrics is available 48-96 hours after online publication and is updated daily on week days.
Initial download of the metrics may take a while.