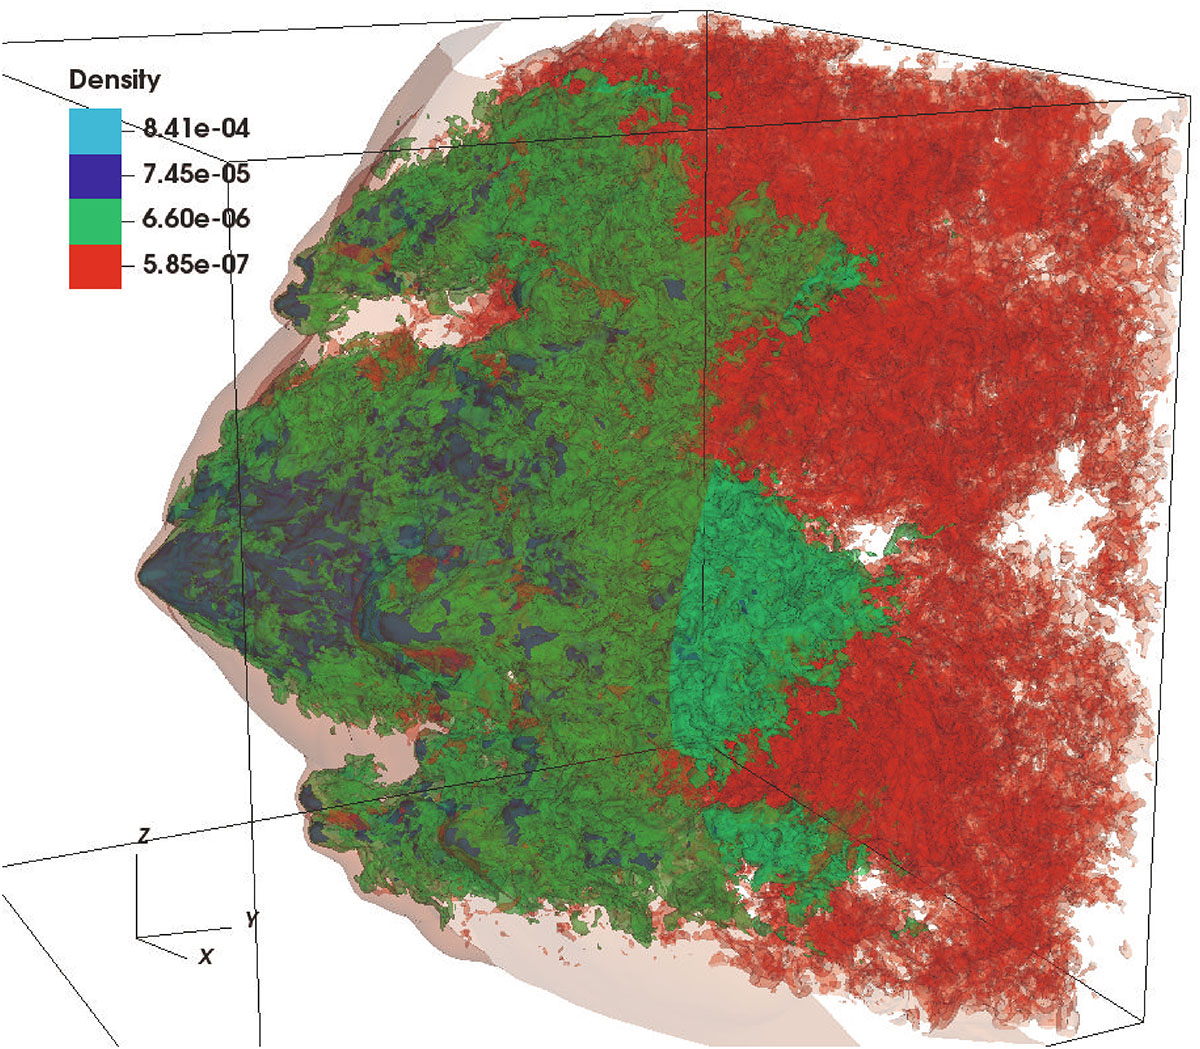
Fig. 5.
Download original image
Coloured surfaces of rest-mass density 3D distribution, in code units, for the evolved structure of simulation S1 at t ≈ 3000 yr, corresponding to the bottom left panel of Fig. 3. The axis of the jet is in the middle of the XZ plane, and the latter propagates along the Y-axis (triad visible in the bottom left of the image) and from left to right; the surfaces show the shocked ejecta interacting with the jet flow, while the nearly transparent red layer surrounding the shocked ejecta outlines the shocked jet region.
Current usage metrics show cumulative count of Article Views (full-text article views including HTML views, PDF and ePub downloads, according to the available data) and Abstracts Views on Vision4Press platform.
Data correspond to usage on the plateform after 2015. The current usage metrics is available 48-96 hours after online publication and is updated daily on week days.
Initial download of the metrics may take a while.